Entity List
Navigate to Unified Catalog > Entity List to view and manage entity assets within the current workspace, such as systems, services, hosts, and databases.
Find Entities
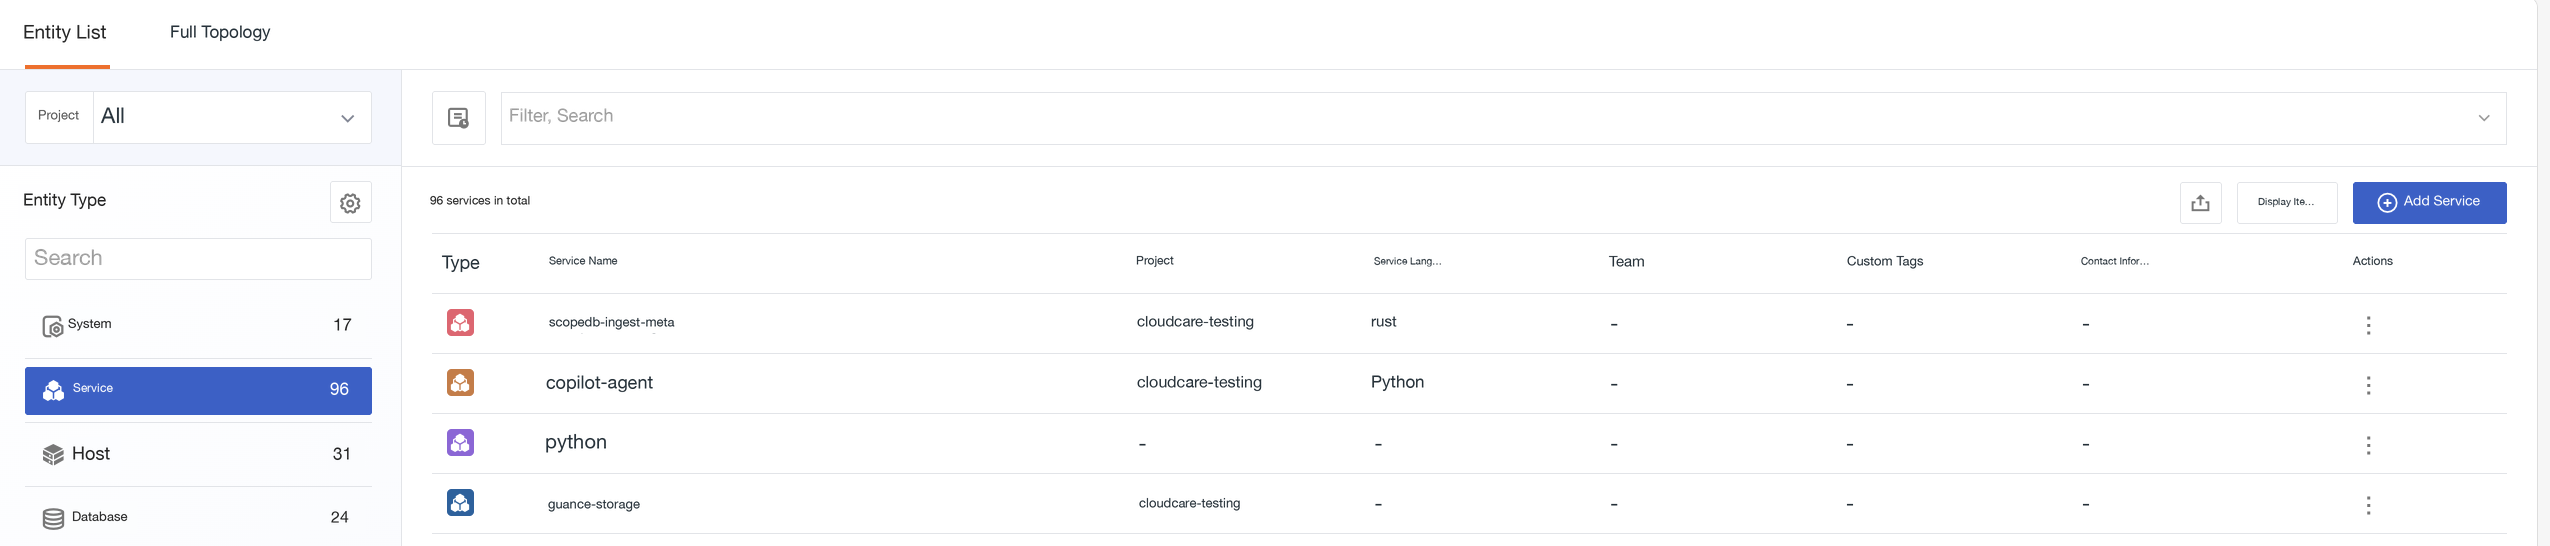
The page defaults to showing entities of the "System" type. The left sidebar displays statistics for each entity type. Click on a type name to switch the view.
You can filter for specific projects using the "Project" dropdown in the top-left corner, or enter keywords in the top search bar to perform fuzzy matching across all string-type fields.
Shortcut
Click the Settings icon in the left sidebar to quickly access:
-
Create Entity: Record new asset information.
-
Manage Entity Types: Jump to the Entity Type Management page to view preset types.
Options
View Mode
When System is selected in the left type panel, the list supports two browsing modes: List and Card. You can switch between them using the button in the top-right corner.
List View
Suitable for high information density scenarios, allowing quick viewing of system summaries and drilling down into component entities as needed.
The main list displays system as the parent object. By default, it includes columns for Type, System Name, Health Score, Entity Count, System Type, Project, Importance Level, Team, Custom Tags, and Actions. Supports sorting by Health Score in ascending or descending order.

Click the expand button in front of a system row to view its Component Entities sub-table. This sub-table includes fields such as Entity Name, Entity Type, Alert Count, Project, Team, Tags, and Last Updated Time.

Card View
Card mode is better suited for quickly browsing the overall status of multiple systems. Each card focuses on one system, intuitively presenting its Health Score, total entity count, number of entities with alerts, last alert time, and other core summaries. It does not expand the detailed entity list, avoiding information overload.
- The card header displays the system icon and name on the left, and the Health Score status and action shortcuts directly on the right.
- If a system currently has no alerts, the "Last Alert Time" is displayed as
-. - If the Health Score cannot be calculated temporarily, it is marked as "Unknown".
Customize Display
The fields in the entity list are dynamically generated based on the YAML configuration of the selected type. Click the "Display Items" button in the top-right corner to toggle the following fields on or off:
- System Type: The classification identifier of the entity.
- Project: The name of the associated project.
- Environment: e.g., Production, Testing, Development.
- Importance Level: e.g., critical, normal.
- Team: The name of the responsible team. Click to jump to details.
- Custom Tags: A maximum of 2 tags are displayed.
Note
The display item configuration only applies to the current user and does not affect other members' views.
Export Data
Click the "Export" icon to export all entities under the current filter conditions (not limited by pagination) in CSV format.
View Details
Click on an entity name in the list to slide out the Details Page on the right, displaying complete metadata, relationship topology, and associated observation data.
Quick Actions
Click the icon to access:
- Edit: Modify entity information.
- Delete: Delete the entity after secondary confirmation.
Further Reading
You might also be interested in: