Network Flow Data
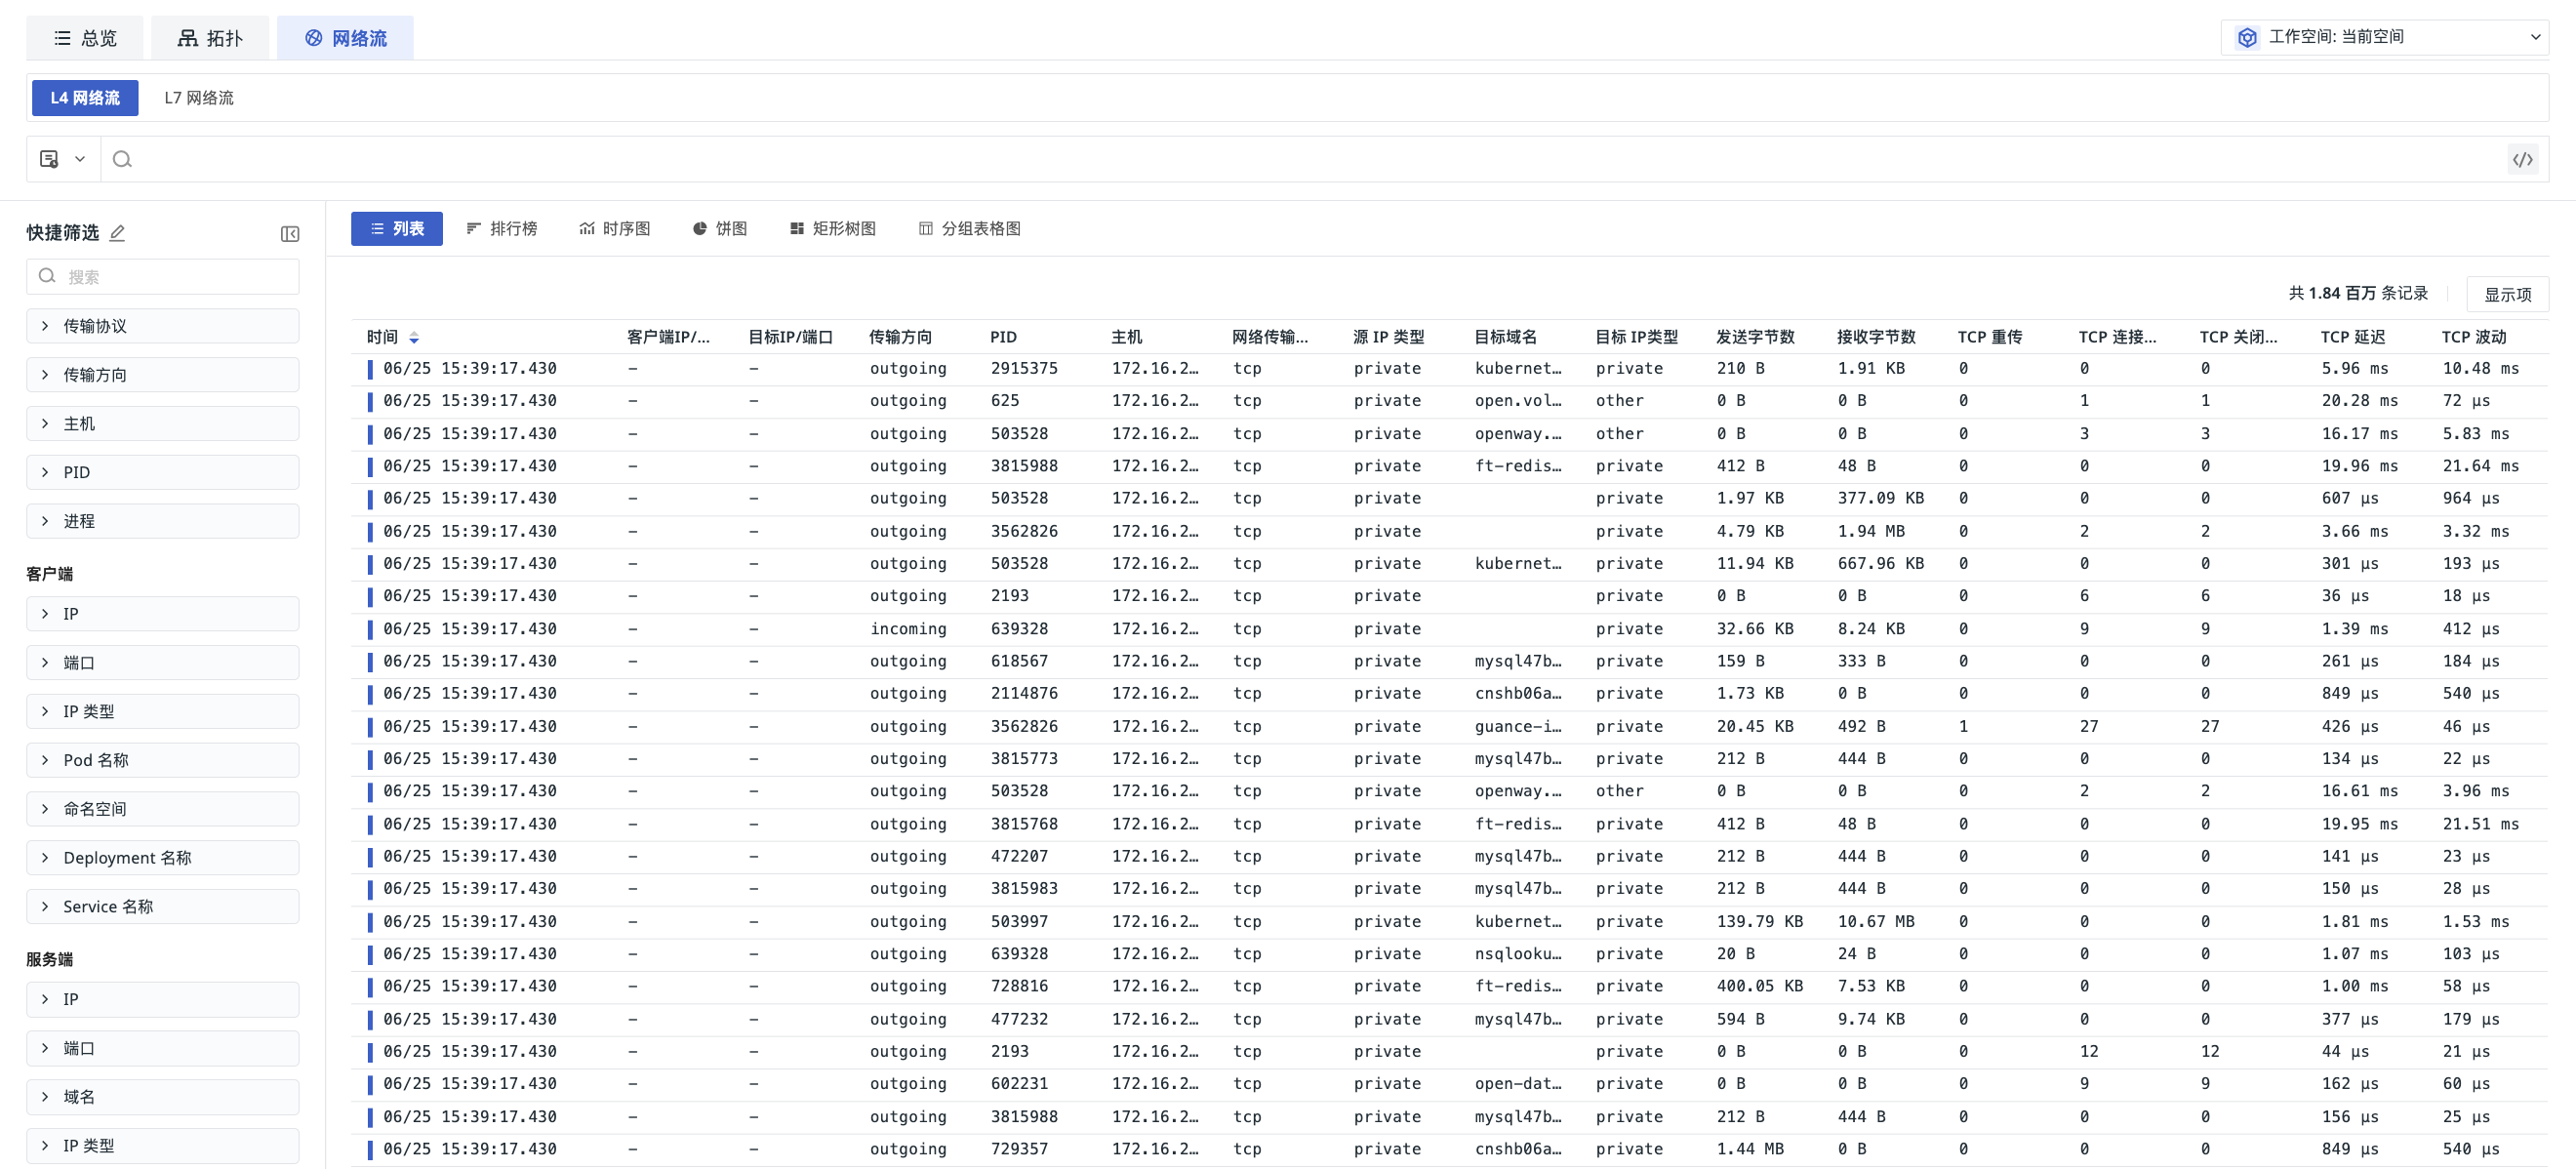
Enter Infrastructure > Network > Network Flow to switch between List and Topology views.
List
By default, the List view is displayed. You can view network connections and application protocol data across the Time Series and analyze network traffic distribution and trends through different charts.
Data Types
- Network Connections: Displays L4 (netflow) network connection data collected at the transport layer, including TCP and UDP connections and related network performance metrics.
- Application Protocols: Displays L7 (httpflow) network request data collected at the application layer.
View Modes
The Network Flow list supports the following display modes:
- List
- Top List
- Time Series Chart
- Pie Chart
- Treemap
- Grouped Table Chart
Page Operations
- Global Configuration: Unified settings for the display and query configurations of the current Explorer.
- Search and Filter: Filter Network Flow data by keywords or field conditions.
- Chart Switching: Switch between different data display modes based on analysis objectives.
- Time Range: Adjust the data query range using the Time Widget at the top.
- Workspace: Supports switching the workspace for the current query.
Topology
Switch to Topology to view upstream and downstream network relationships by Host, Pod, Deployment, and Service.