Error
View the front-end errors emitted by the browser while users are using the application, including error types, error content, and more.
In the Error Explorer, you can:
-
View all error types and their related error details in one place;
-
Use Sourcemap to restore the obfuscated code, making it easier to locate source code during error troubleshooting and helping users resolve issues faster.
Explorer List
All Errors
In the Error Explorer, you can quickly view the page URL, code error types, error content, and more from user visits.
-
Error content "Load failed": an error without a
response; the SDK appends "Load failed" by default; -
Error content "Network request failed": the
responsereturns an error.

Pattern
If you need to view errors that occur frequently, in the TrueWatch Workspace, go to RUM > Explorer > Error and select the Pattern list.
Pattern analysis calculates the similarity of all error trace data based on the clustering fields. Based on the time range selected in the upper-right corner, it fixes the current time period, retrieves 10,000 data entries within that time period for pattern analysis, aggregates error traces with high similarity, and extracts and counts common Pattern clusters to help you quickly discover anomalous traces and locate issues.
By default, aggregation is based on the error_message field. You can customize the clustering fields, with a maximum of 3 fields.

-
In the Pattern list, you can click any error to view all related Errors. Click a trace to enter the details page for analysis;
-
On the Pattern page, click the sort icons & to sort the document count in ascending/descending order (descending by default).
Details Page
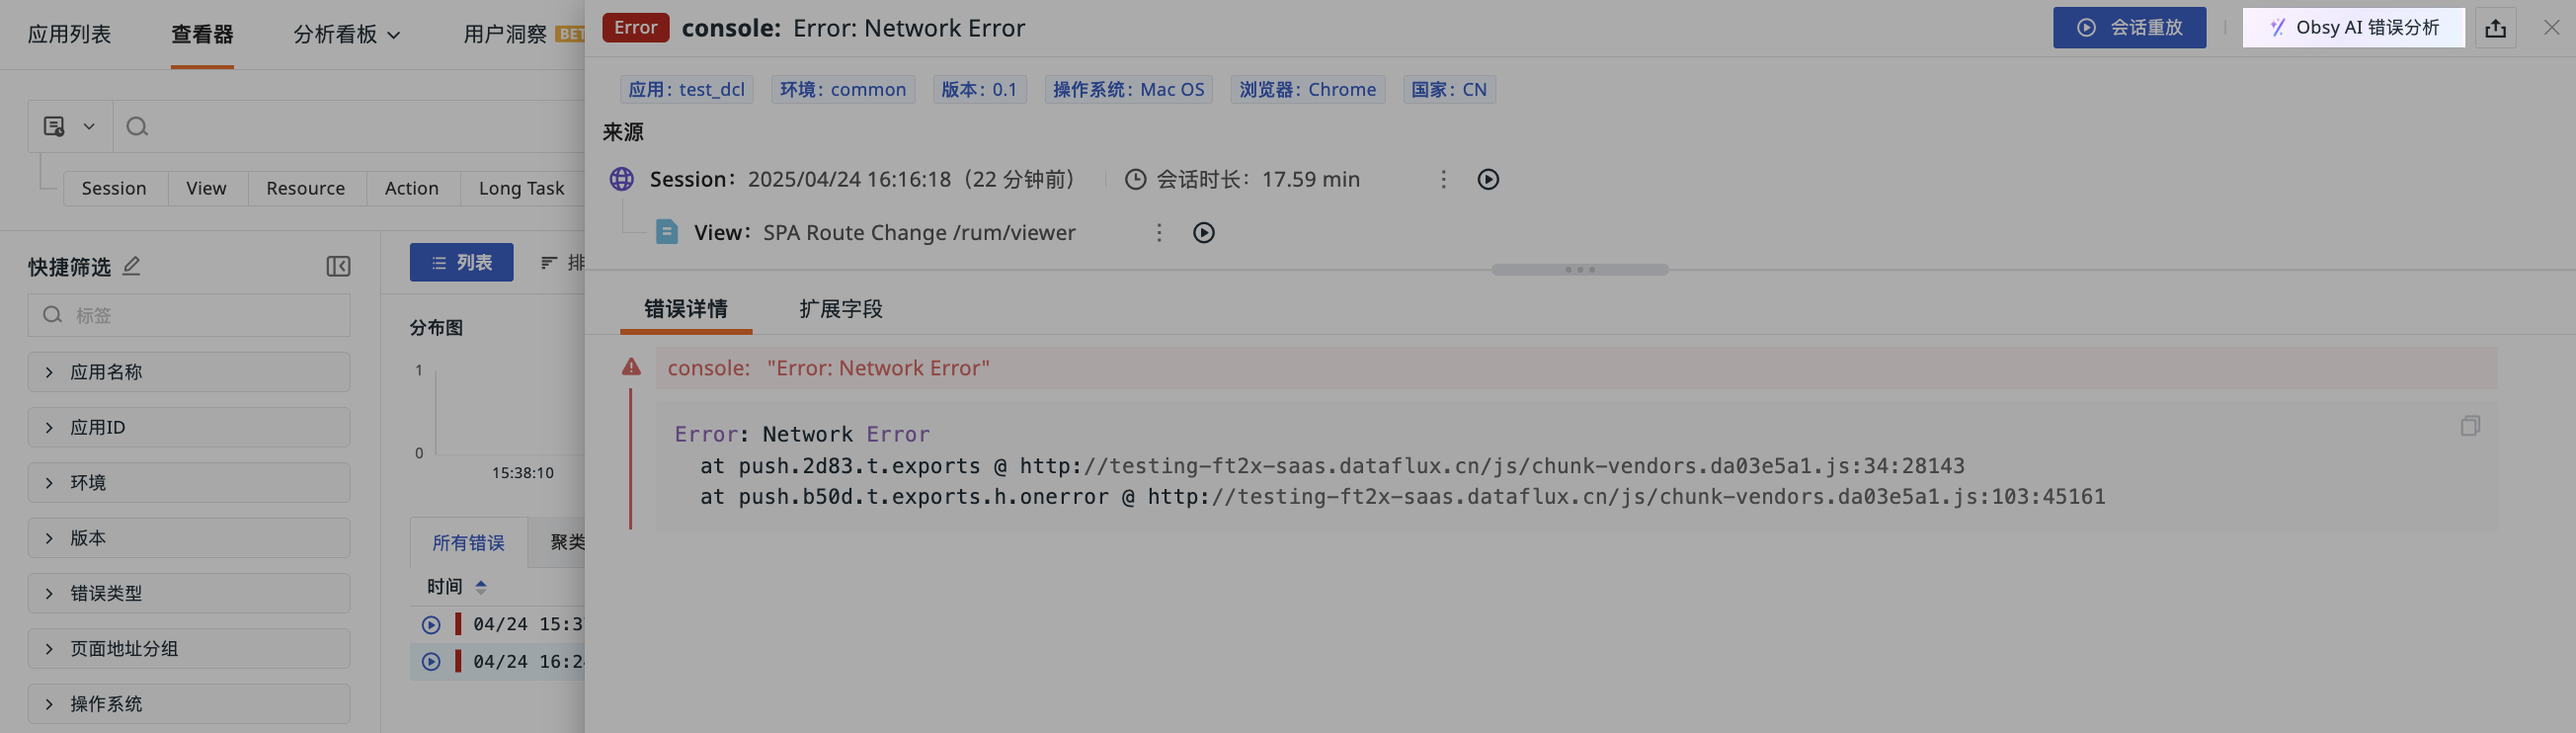
Click a data entry in the list to view its details page, where you can view the error details of user visits, including error details, extended fields, and related traces.

Source
In Source, you can view the Session / View / Action details of the current Error, and filter or copy to view the current Session ID / View ID / Action ID.
Error Distribution Chart
The Error Distribution Chart aggregates and counts errors with high similarity, and based on the time range selected in the Explorer, automatically selects the corresponding time interval to display the error distribution trend, helping you intuitively view the time points or time ranges when errors occur frequently and quickly locate error issues.
Error Details
In Error Details, you can view the specific content of the error.
Sourcemap
When an application is released in a production environment, to prevent security issues such as code leakage, the packaging process generally transforms and compresses files. While these measures ensure code security, they also cause the collected error stack information to be obfuscated, making it impossible to directly locate the problem and creating inconvenience for subsequent bug troubleshooting.
TrueWatch provides the Sourcemap feature for applications, which restores the obfuscated code, making it easier to locate source code during error troubleshooting and helping users resolve issues faster.
You can configure it through RUM Sourcemap Configuration or DataKit Collector Sourcemap Transformation. After configuration, you can view the parsed code and the original code in the error details.
Note: Currently, only Web applications support Sourcemap configuration in RUM.
Parsed Code Example
Parsed code example with Sourcemap configured in RUM:

Original Code Example

Parsed code example with Sourcemap configured via the DataKit Collector:

Note: If Sourcemap is configured in both RUM and the DataKit Collector, the parsed format configured in RUM will be displayed.
Extended Fields
In the search bar, enter a field name or value to quickly search and locate;
After checking the field alias, you can view it after the field name; select as needed.
On the trace details page, you can view the related field attributes of the current trace in Extended Fields:
| Field | Attribute |
|---|---|
| Filter by Field Value | Adds the field to the Explorer to view all data related to that field. You can filter the trace list by this field in the Trace Explorer. |
| Exclude Field Value | Adds the field to the Explorer to view all data except that field. |
| Add to Display Columns | Adds the field to the Explorer list for viewing. |
| Copy | Copies the field to the clipboard. |

TOBY AI TruePilot Error Analysis
TrueWatch provides one-click parsing of error data. It leverages large language models to automatically extract key information from the data and, combined with online search engines and operations knowledge bases, quickly analyzes possible root causes and provides preliminary solutions.
- Click a single data entry to expand the details page;
- Click TOBY AI TruePilot Error Analysis in the upper-right corner;
- Start anomaly analysis.