Monitor List
The Monitor List displays all configured monitors and key information such as Alert Policy, creator, and updater. It supports efficient monitor management through search, filtering, import, and other features. You can also jump directly to the anomaly events triggered by a monitor and its operation logs, ensuring transparency and traceability of monitor status and behavior.
Single Rule
For a single monitor rule, you can perform the following operations:
-
Enable/Disable: You can enable or disable a monitor. New monitors are enabled by default; after disabling, you can re-enable them.
-
Clone Monitor: You can directly clone the selected monitor.
-
Edit Monitor: You can edit the monitor status and rule configuration.
-
Manually Trigger Detection: You can manually trigger monitor detection. Mute rules take effect, and once triggered, an event is generated and an alert is sent.
-
Operation Audit: You can view operation records related to the monitor.
-
View Related Events: You can view the unrecovered events triggered by this monitor and perform Event Management.
-
View Related Views: You can associate dashboards with the monitor, and configure this during editing.
-
Delete Monitor: You can delete the monitor. Deleted data cannot be recovered, but event data is retained.
Batch Operations
You can batch enable, disable, delete, export, and edit tags for monitors.
You can also configure an Alert Policy directly here and apply it to the selected monitors. The new Alert Policy configuration overrides the existing alert settings of the monitors.
Edit Tags
Both regular monitors and smart monitors support batch tag editing:
- Select one or more monitors in the Monitor List.
- Click Edit Tags in the batch operations bar.
- Select Add Tag or Remove Tag.
- Select one or more tags, then click OK.
Note
- Adding tags preserves the other tags already associated with the monitor.
- Removing tags only disassociates the tags from the monitor and does not delete global tags.
- Members with tag management permission can create new tags when adding tags; other members with monitor configuration permission can select existing tags.
Tag Display
The system supports adding tags to monitors. You can select existing tags or manually enter a new tag and press Enter to create it. Events triggered by monitor detection also include these tags.
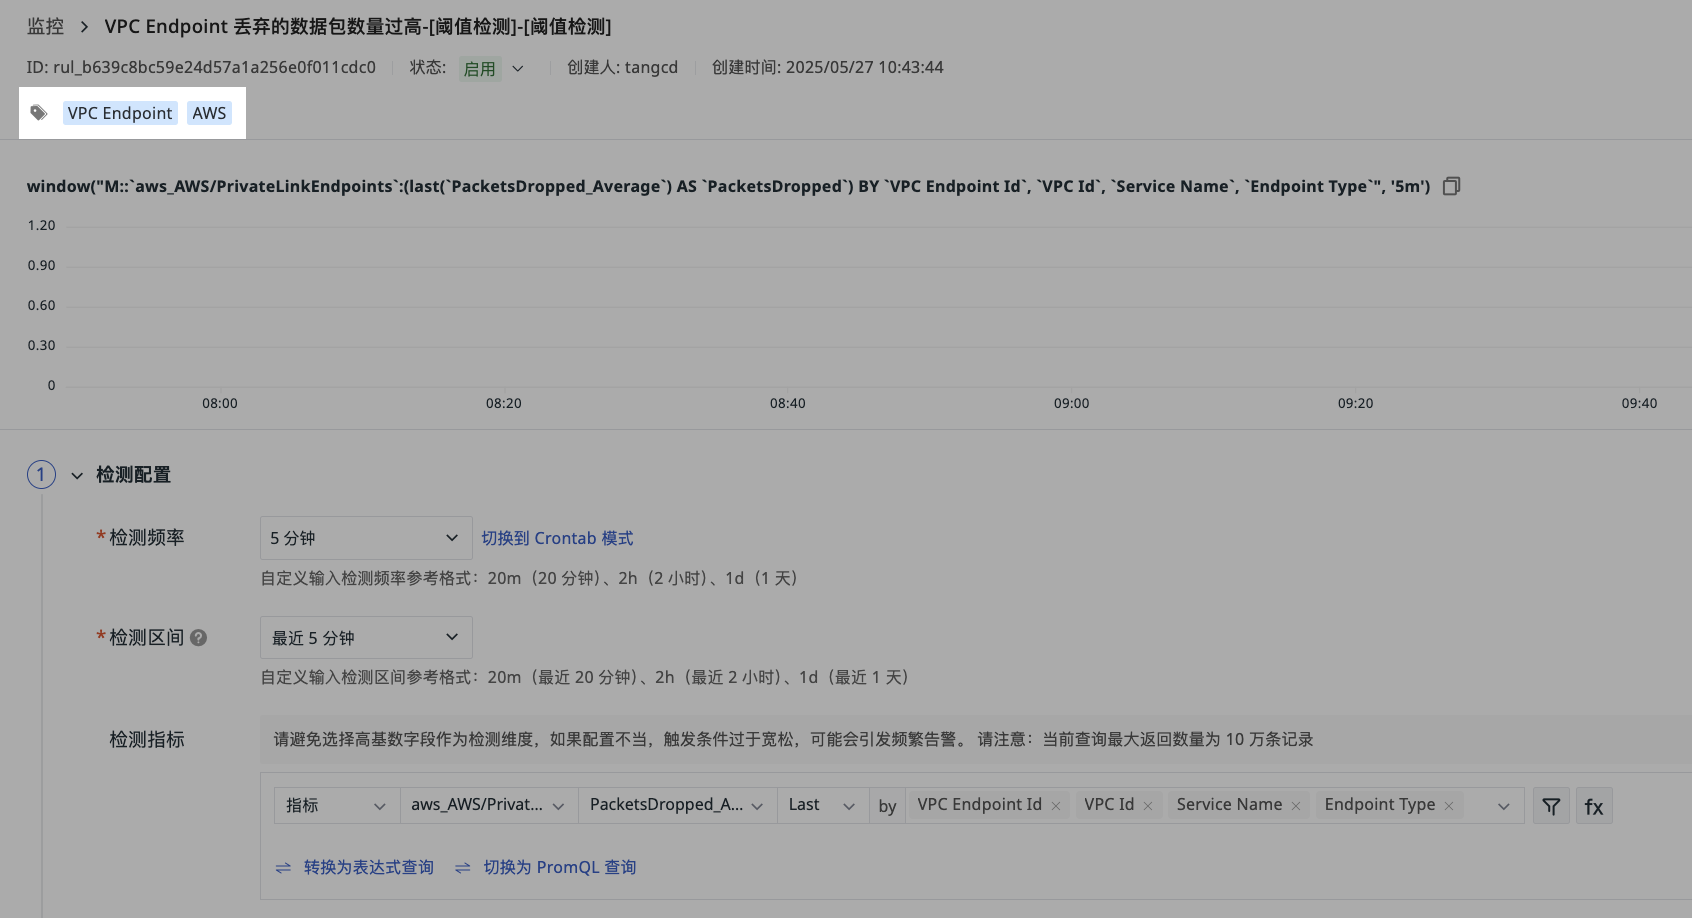
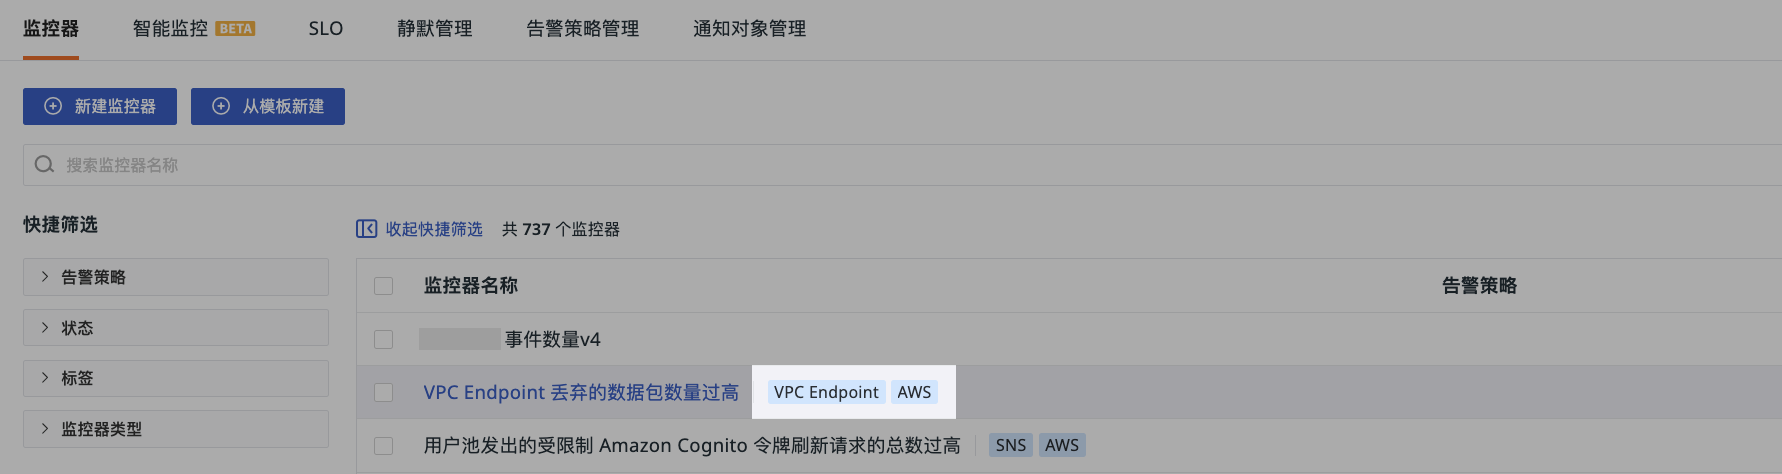
After saving, added tags are displayed directly in the list. You can use the Quick Filter > Tags on the left to quickly find monitors associated with a specific tag.
Additional Notes on Tag Logic
- Tag values are not restricted to a particular format. They can be
value(for example,host) orkey:value(for example,host:123). - If a custom tag
keyconflicts with another event attribute (except fortags), the custom tag is discarded. For example, if a monitor groups byhostand generates the event attributehost:001, the custom taghost:000added at the same time will be discarded and will not be written to the event attributes.
Display for Revoked Authorization
If data authorization has been revoked for the current workspace, monitors that query the corresponding data are automatically disabled. In the current Monitor Explorer, a ! symbol appears after the monitor name, indicating that the current cross-workspace data authorization is invalid. You should check whether the related authorization has changed.
SLO Integration
Monitors added to an SLO as SLIs display a special badge:

Hover to view the list of associated SLOs, and click to open the SLO details page.
Alert Policy
The Alert Policy feature lets you create meaningful monitor combinations when setting up monitors. Filtering monitors by Alert Policy makes them easier to manage.
Note
- If no Alert Policy is configured, monitor anomaly event detection sets a 2-minute processing wait time to avoid data issues caused by network or database write latency.
- Each monitor must select an Alert Policy when created; the system default is "Default".
- When an Alert Policy is deleted, the monitors under it are automatically assigned to "Default".
For more details, see How to Create and Manage Alert Policies.
Multiple Rules
For multiple rules at the list level of monitor rules, you can perform the following operations.
Filter and Search
Use the Quick Filter on the left to quickly locate target monitors by Alert Policy, status, tags, and monitor type.
You can also search directly by monitor name, monitor ID, or Alert Policy name in the search box.
Import
The imported JSON file must come from a monitor configuration file exported by the system. After import, the monitors are automatically classified according to their original grouping. If you select "Delete and import monitors with the same name", the system first deletes the existing same-name monitors and then performs the import.
During import:
- If a monitor with the same name exists, you can choose to delete the existing same-name monitor.
- If some monitors involve cross-workspace monitoring and the current workspace has not been authorized by the target workspace, those monitors will fail to import.
Export All
Click Export All to export all monitor rule configurations in the current workspace.