Log Details
In the log list, click the expand icon on the left side of a single log to slide out the details page of the current log and view detailed log information, including the log generation time, host, source, service, content, extended fields, context view, and more.
View Full Log
When logs are reported to TrueWatch, if a single log entry exceeds 1M, the system splits it into multiple entries according to the 1M standard. For example, a 2.5M log is split into 3 entries: 1M, 1M, and 0.5M. You can view the completeness of the split log through the following fields:
Field |
Type | Description |
|---|---|---|
__truncated_id |
string | The unique identifier of a log. Log entries split from the same record use the same __truncated_id, with an ID prefix of LT_xxx. |
__truncated_count |
number | The total number of split log entries. |
__truncated_number |
number | The split order of the log, starting from 0. 0 indicates the first entry of the log. |
On the log details page, if the current log has been split into multiple entries, a View Full Log button appears in the upper right corner of the page. Clicking this button opens a new page that lists all related logs in split order. At the same time, the page highlights the log selected before the jump with color, so you can quickly locate upstream and downstream logs.
TOBY AI TruePilot Error Analysis
TrueWatch provides one-click parsing for error logs. It uses a large model to automatically extract key information from logs and, combined with online search engines and operational knowledge bases, quickly analyzes possible causes of failures and provides preliminary solutions.
- Filter all logs with status
error; - Click a single record to expand the details page;
- Click TOBY AI TruePilot Error Analysis in the upper right corner;
- Anomaly analysis then begins.

Error Details
If the current log contains error_stack or error_message field information, the system provides the error details related to this log.

To view more log error information, see Log Error Tracking.
Attribute Fields
Click an attribute field to quickly filter and view host, process, trace, and container data related to the log.
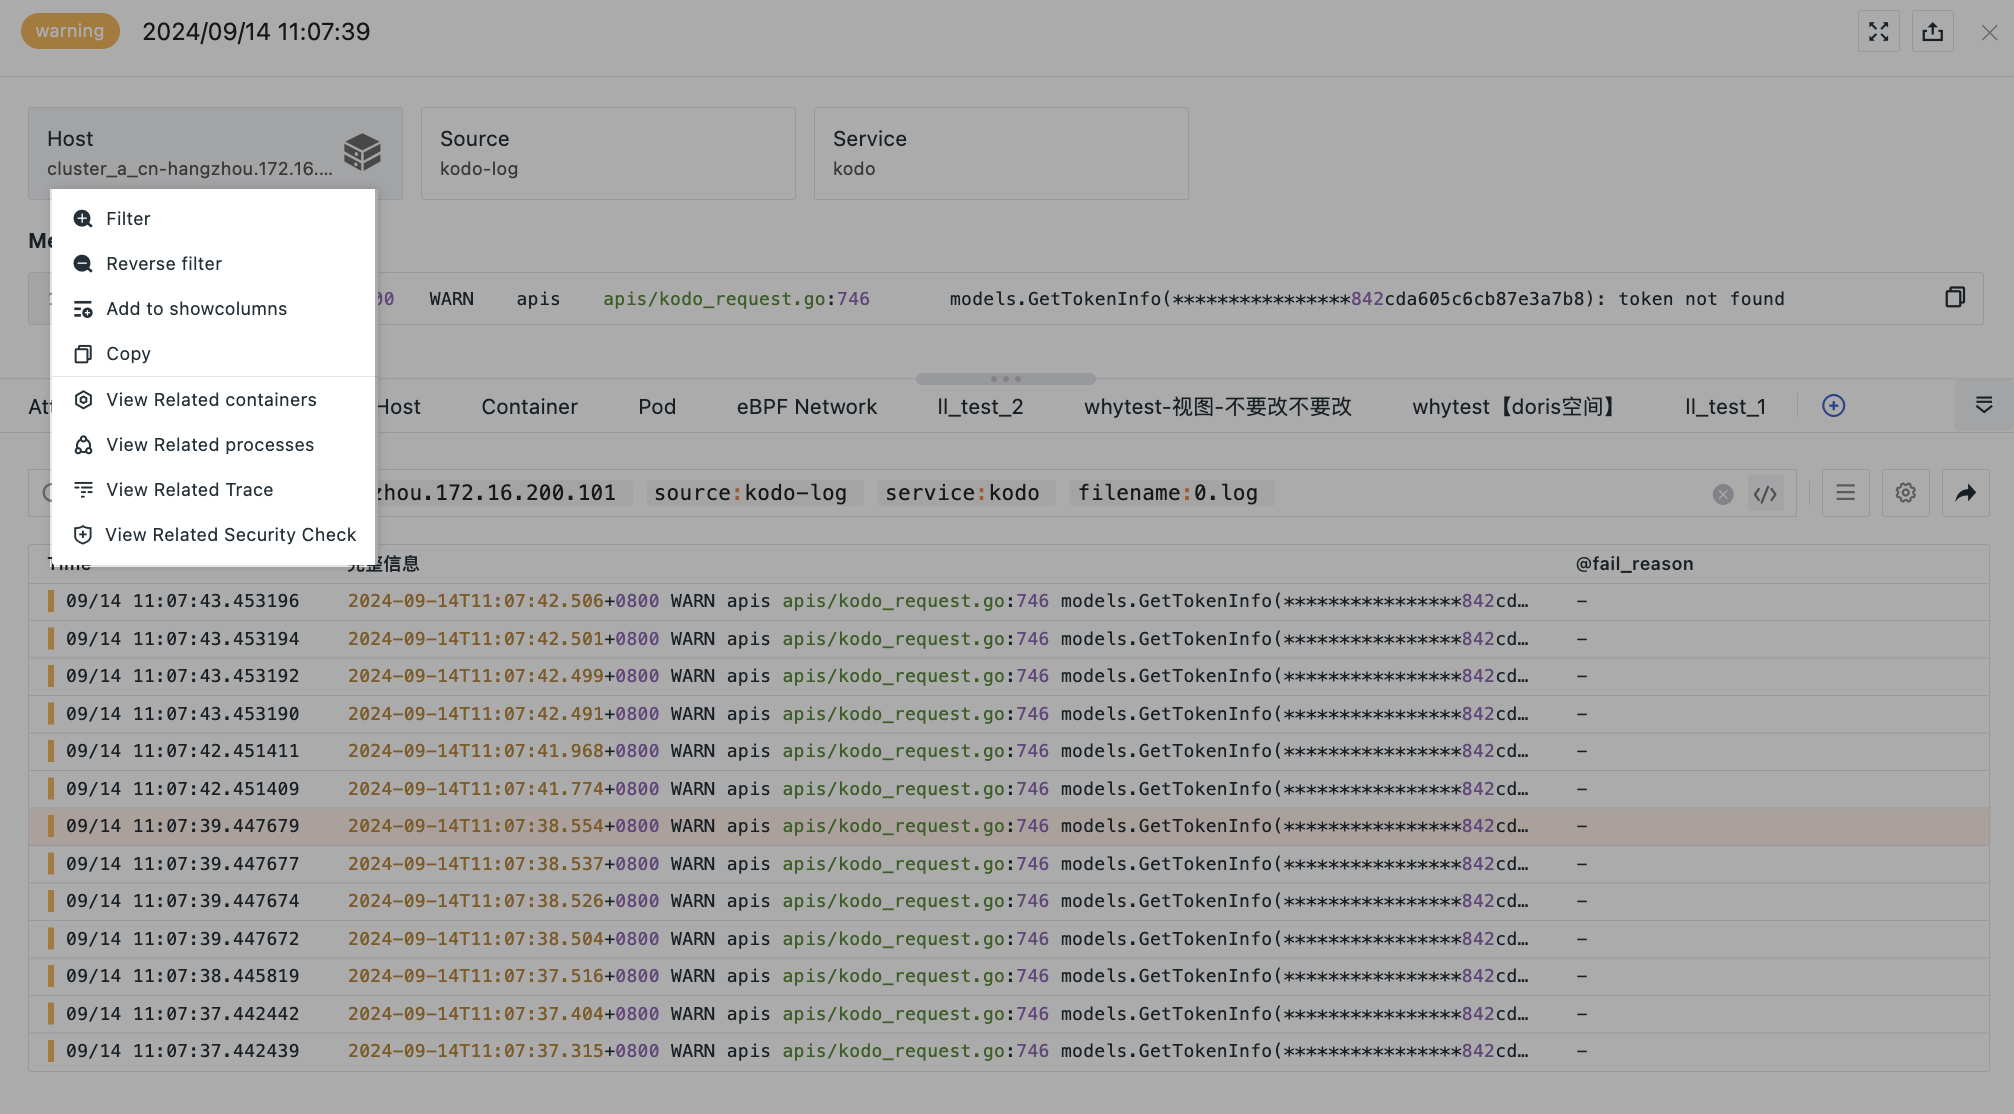
| Field | Description |
|---|---|
| Filter Field Value | Add this field to the log explorer to view all log data related to this field |
| Exclude Field Value | Add this field to the log explorer to view all related log data except this field |
| Add to Display Columns | Add this field to the explorer list for viewing |
| Copy | Copy this field to the clipboard |
| View Related Containers | View all containers related to this host |
| View Related Processes | View all processes related to this host |
| View Related Traces | View all traces related to this host |
| View Related Inspections | View all inspection data related to this host |
Log Content
Log content automatically switches between JSON and text view modes based on the message type. The log details display log content according to the index mode and log fields:
- When
messageexists in the log, themessagecontent is displayed first, and the view switches between JSON and text mode based on the content type; - When full-text index logs have no
message, the system displays the log content using a combination of the current log's business fields; - System fields are not part of the full-text index log content;
- Log content supports expansion and collapse. It is expanded by default, and collapses to a single line when collapsed.
Log content supports expansion and collapse. It is expanded by default; when collapsed, only one line height is displayed.
For logs with source:bpf_net_l4_log, JSON and packet view modes are automatically provided. Packet mode displays the client, server, time, and other information, and supports switching between absolute time and relative time display, with absolute time as the default. The switched configuration is saved in the local browser.

Selecting Log Segments
In log content that supports segment operations, you can click a Chinese or mixed Chinese-English segment and use the menu to filter, exclude, or copy. Clicking a segment only opens the menu; the query is updated only after a filter operation is selected.
The selection scope depends on the text format and display position:
| Content Type | Selection Rules |
|---|---|
| Plain text | Separated by whitespace and common punctuation. Chinese commas, periods, semicolons, colons, exclamation marks, question marks, enumeration commas, parentheses, corner brackets, book title marks, and quotation marks can serve as separators; English quotation marks, question marks, equal signs, commas, and parentheses can also separate segments. Consecutive Chinese characters are not automatically split by word meaning. |
| Specific formats such as identifiers, paths, IPs, and time | Recognized according to the corresponding format, in which connectors such as _, -, /, and : may be retained in the selected content and are not always split by symbol. |
| URL | Recognized as a whole, preserving symbols such as ?, =, &, and # inside the URL; URL recognition ends when whitespace, English quotation marks, or angle brackets are encountered. |
For example, in the plain text 用户登录失败,请重试。 ("User login failed, please try again."), you can select "用户登录失败" ("User login failed") or "请重试" ("Please try again"); in 调用API失败 请稍后重试 ("API call failed, please try again later"), you can select the two space-separated segments "调用API失败" ("API call failed") and "请稍后重试" ("Please try again later"). The URL https://example.com/search?q=日志&limit=10#result is recognized as a whole and is not split due to internal query parameters or fragment identifiers.
Text Selection Differences Across Display Positions
Content inside double quotation marks or square brackets in the log details body may be selectable as a whole segment, and its selection behavior is not fully consistent with hover selection in the list or JSON display. When operating, refer to the current selection range.
When filtering, the system appends the selected segment to the current query while preserving the existing index, time range, workspace, and other filter conditions. If part of the text matches the search highlight, clicking still selects the complete segment.
When filtering via a JSON field, the corresponding actual field path is still used. Modes such as DQL and SLS continue to follow the operation restrictions and conversion confirmation rules of the current entry.
JSON Search
In JSON-format logs, JSON search can be performed on both key and value. After clicking, the explorer search bar adds the @key:value format for searching.
For multi-level JSON data, . is used to represent the hierarchical relationship. For example, @key1.key2:value searches for the value corresponding to key2 under key1.

For more details, see JSON Search.
Extended Fields
-
In the search bar, you can enter a field name or value to quickly search and locate;
-
After selecting a field alias, it can be viewed after the field name;

-
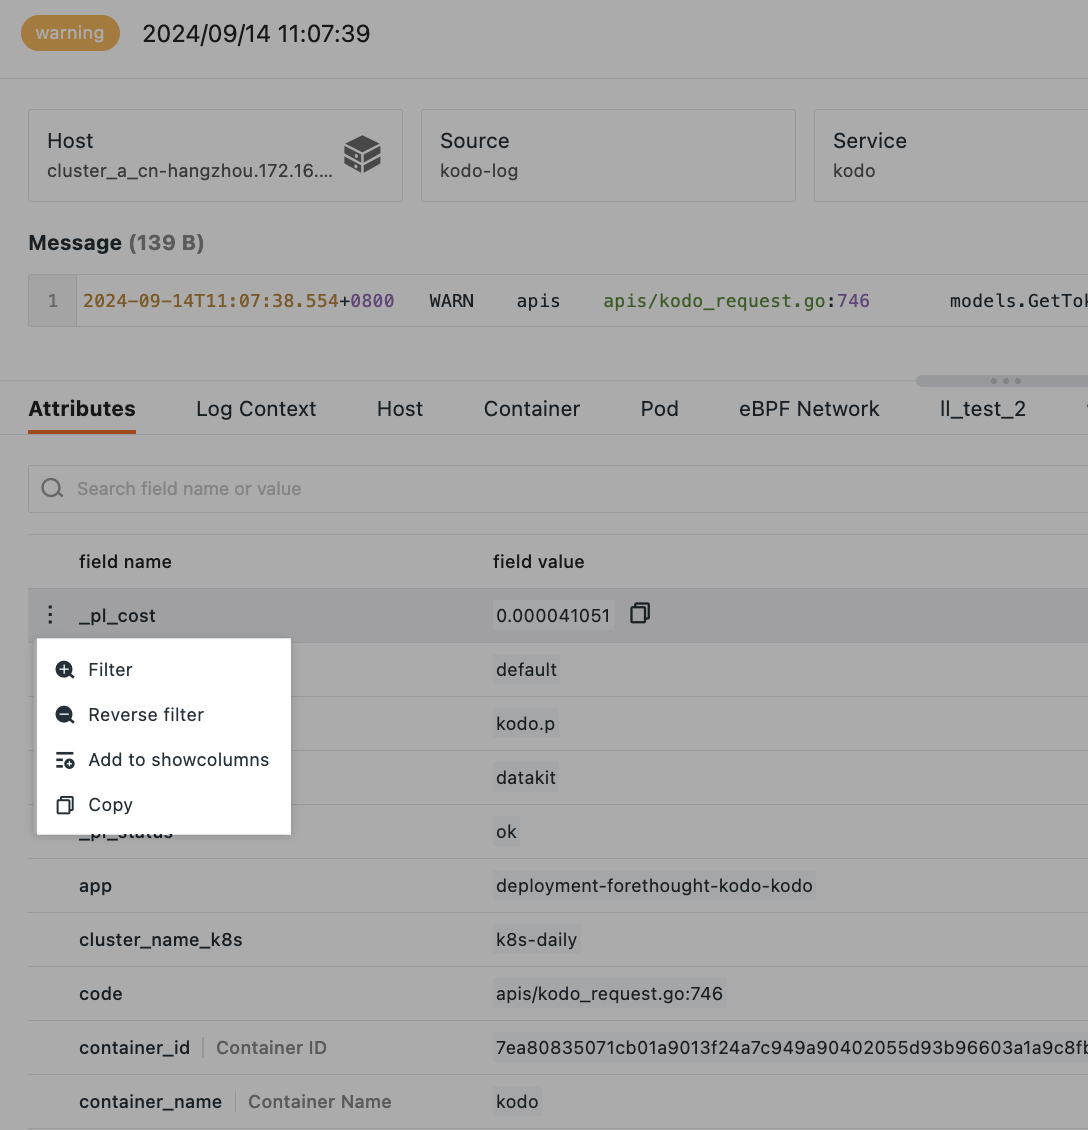
Hover over an extended field and click the dropdown icon to choose the following operations for that field:
-
Filter Field Value
-
Exclude Field Value
-
Add to Display Columns
-
Dimension Analysis: click to jump to Analysis mode > Time Series Chart
-
Copy
-
Note
If you choose to add a field to the display columns, an icon appears in the list for easy identification.

Context Logs
The context query feature of the log service uses time clues to help you trace the records around an anomalous log and quickly locate the root cause of the problem.
-
On the log details page, you can directly view the context logs of this record;
-
Use the dropdown on the left to select an index and filter the corresponding data;
-
Sort the data;
-
Jump directly from the current details page to a new log explorer page;
Additional Notes on the Related Logic
Based on the returned data, 50 records are loaded on each scroll.
How is the returned data queried?
Prerequisite: Does the log have the log_read_lines field? If it does, follow logic a; if not, follow logic b.
a. Get the log_read_lines value of the current log, and apply it to the filter log_read_lines >= {{log_read_lines.value-30}} and log_read_lines <= {{log_read_lines.value +30}}
DQL example: current log line number = 1354170
Then:
L::RE(`.*`):(`message`) { `index` = 'default' and `host` = "ip-172-31-204-89.cn-northwest-1" AND `source` = "kodo-log" AND `service` = "kodo-inner" AND `filename` = "0.log" and `log_read_lines` >= 1354140 and `log_read_lines` <= 1354200} sorder by log_read_lines
b. Get the current log time and extrapolate forward/backward to determine the query start and end times
-
Start time: 5 minutes before the current log time
-
End time: take the 50 records after the current log and use the time of the 50th record (·). If
time= the current log time, usetime+1 microsecondas the end time; iftime≠ the current log time, usetimeas the end time
Log Context Page
Click to jump to the log context page. You can manage all current data through the following operations:
-
Enter text in the search box to search and locate data;
-
Click the button on the side to switch the system default automatic line wrapping to content overflow mode, where each log is displayed as a single line and you can scroll left or right as needed;
-
Return to top/bottom;
-
Load 100 records upward/downward;
-
Click the export icon to export the current log context data.
Related Analysis
The system supports related analysis of log data. In addition to error details, extended fields, and context logs, you can also understand at a glance the host, containers, network, and other resources corresponding to the log.
Built-in Pages
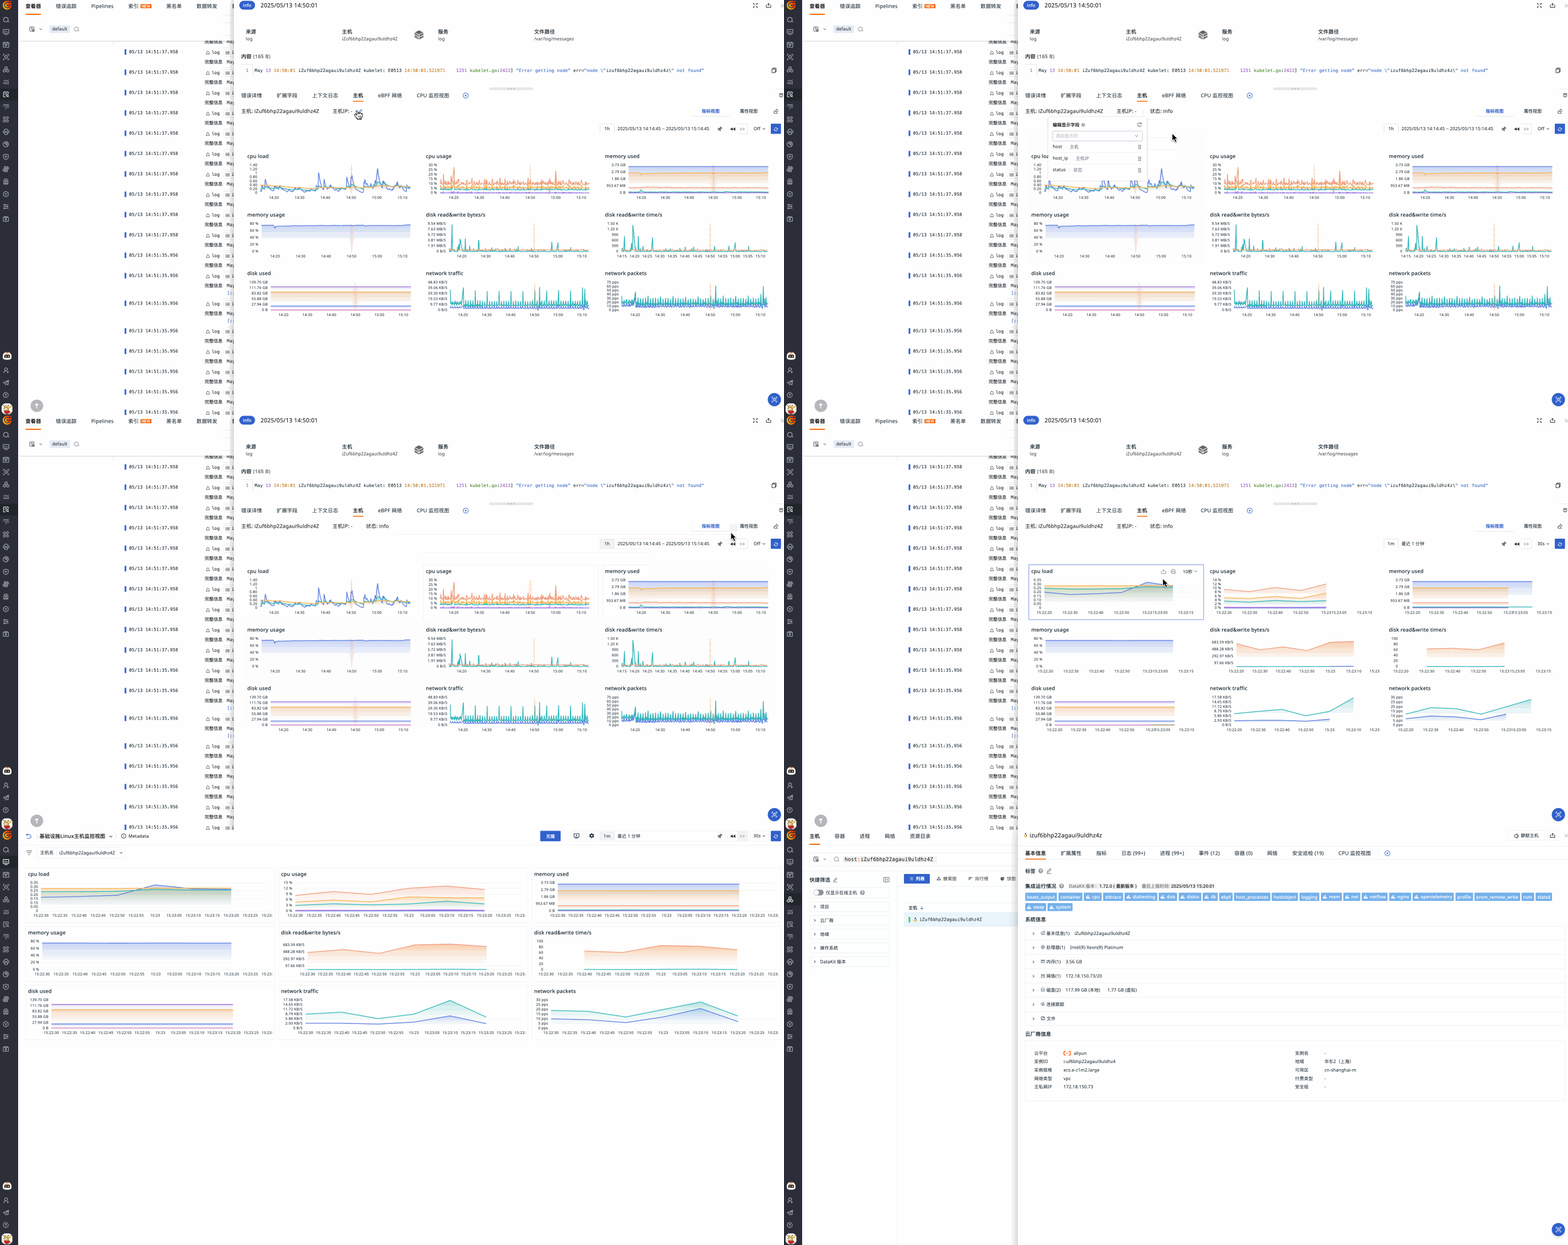
For built-in pages such as Host, Containers, and Pods, you can perform the following operations:
(Using the "Host" built-in page as an example)
-
Edit the display fields of the current page, and the system automatically matches the corresponding data based on the fields;
-
Choose to jump to the metrics view or host details page;
-
Filter the time range.
Note
Only workspace administrators can modify the display fields of built-in pages. Configuring common fields is recommended. If the page is shared by multiple explorers, field modifications take effect in real time.
For example: if you configure the "index" field here, logs that contain this field display normally, whereas a trace explorer that lacks this field cannot display the corresponding value.
Built-in Views
In addition to the views displayed by default here, you can also bind custom views.
-
Go to the built-in view binding page;
-
View the default associated fields. You can choose to keep or delete fields, and add new
key:valuefields; -
Select a view;
-
After binding is complete, you can view the bound built-in view in the host object details. Click the jump button to go to the corresponding built-in view page.
