Metrics Management
After completing metrics data collection, you can view all reported measurements and their associated metrics, tags, time series count statistics, day-over-day changes, and data storage policies in Metrics Management.
Measurement
A measurement is a collection of similar metrics, containing multiple metrics and tags. A single measurement displayed by the system includes the following information:
Metrics
Metrics reflect the operational status of a system (e.g., CPU usage, page load time) and consist of a metric name (identifier) and a metric value (specific numerical value).
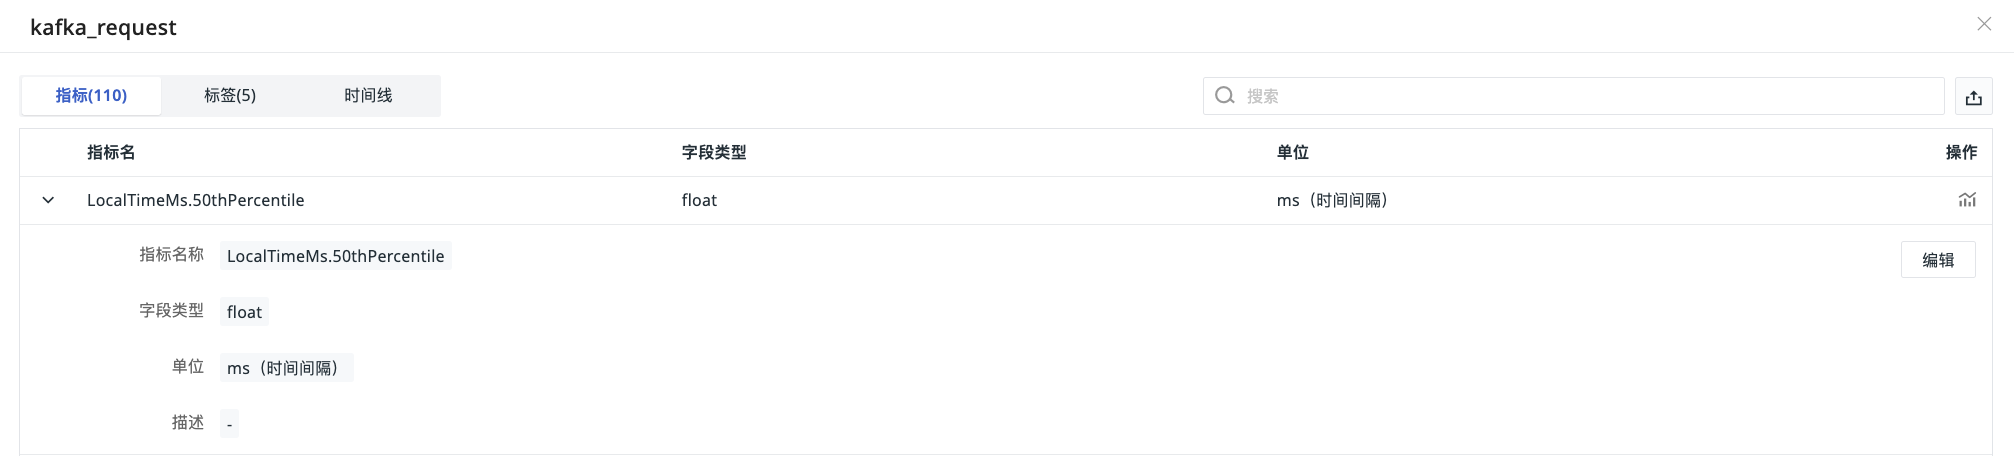
Clicking on a measurement name allows you to view complete metric details (metric name, original metric, field type, unit, description) and supports the following operations:
- Filter metrics based on keywords in the search bar;
- Export the metric list as a CSV file;
- In the options column, support one-click metric analysis;
- Click to expand metric data to edit metric configuration.
Permissions and Priority
- Edit Permissions: Only standard members and above can perform operations;
- Configuration Priority: Custom units and descriptions defined in Metrics Management take precedence over default collected data. For example, after changing the unit from
BtoGB, chart queries in scenarios will automatically display data inGB.
Tags
The attributes of a data point collection object are identified by tags. These tags are presented as key-value pairs, consisting of a tag key and a tag value. A single data point can have multiple tags attached.
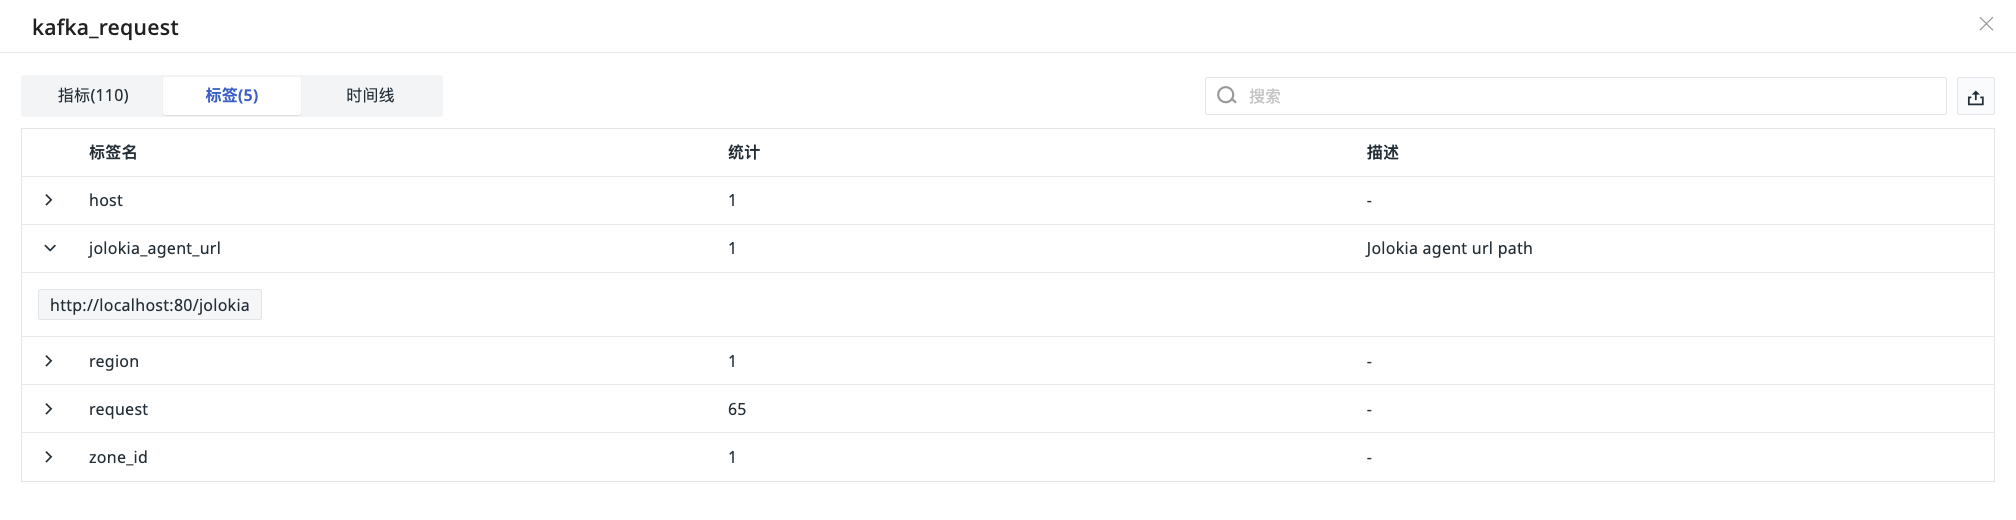
Clicking on a measurement name allows you to view the corresponding tag list, including tag key, tag value count statistics, description, and other information, and supports the following operations:
- Filter tags based on keywords in the search bar;
- Export the tag list as a CSV file.
Time Series
Time series are dynamically generated by tag combinations and include metrics, tags (fields), and data storage duration. Among these, "metric + tags (field combination)" constitutes the primary key for data storage.
In TrueWatch, this section displays the total number of time series for the current measurement and presents the unique value count, time series count, and day-over-day changes for a single metric/tag through metric statistics charts and tag statistics charts.
Calculation Logic
The metric/tag statistics charts perform statistical calculations based on the hierarchy: Overall Metrics -> Single Metric -> Grouping of that metric by tags -> Specific tag values -> Global view of all tags + tag-specific statistics.
In the statistics charts, the calculation logic for each field is as follows:
| Field | Description |
|---|---|
| Unique Value Count | Counts the distinct values of a tag at the global or single metric level (i.e., how many unique independent values the tag contains) |
| Time Series Count | The number of time series involved for a single metric/single tag value |
| 1d | The change in the number of time series compared to the previous day |
| 1d% | 1d / Yesterday's time series count |
| Total Proportion |
| Term | Description |
|---|---|
| Database | Database container storing data |
| Measurement | Measurement (similar to a MySQL table) |
| Field | Metric key-value pair (stores actual values, not indexed) |
| Field Set | Collection of multiple Fields |
| Field Key | Key name of a Field (e.g., cpu_usage) |
| Field Value | Numerical value of a Field (e.g., 85.3) |
| Tag | Tag key-value pair (descriptive metadata, indexed) |
| Tag Set | Collection of multiple Tags |
| Tag Key | Key name of a Tag (e.g., host) |
| Tag Value | Value of a Tag (e.g., server-01) |
| TimeStamp | Data point timestamp (nanosecond precision) |
| Retention Policy | Data retention period (e.g., 30 days) |
| Series | Unique time series (Measurement + Tag Set combination) |
Storage Policy
Storage policies are divided into two levels:
-
Workspace Global Settings: Applied to all measurements
-
Measurement Custom Settings: Settings for specific measurements
Modifying Policies
The priority of measurement custom settings is higher than workspace global settings. That is: after customizing a storage policy for a measurement, modifying the global settings will not affect that measurement.
Note
Each policy modification triggers immediate data deletion. Please back up important data in advance.
Important Notes
When modifying a measurement's storage policy, pay attention to the following key rules:
- Immediate Data Deletion: After modifying the policy, the data for that measurement under the original policy will be permanently deleted and cannot be recovered. Subsequent policy modifications will also delete the data under the current policy;
- Independent Storage Mechanism: After setting a custom policy, the measurement data is stored independently. Modifying the global policy duration at this point will not affect measurements that already have custom settings;
- Reverting to Global Policy: When switching back to "Global Default", data will be stored back into the global repository. Thereafter, modifying the global policy will affect this measurement accordingly;
- Same Duration Does Not Equal Same Policy: Even if the custom duration matches the global one, data is still stored independently. Example: Setting a measurement to 7 days when the global setting is 7 days still constitutes independent storage.
Modification Paths
Global Settings
Go to Manage > Workspace Management > Risky Operations > Change Data Storage Policy > Metrics, and select the storage duration.
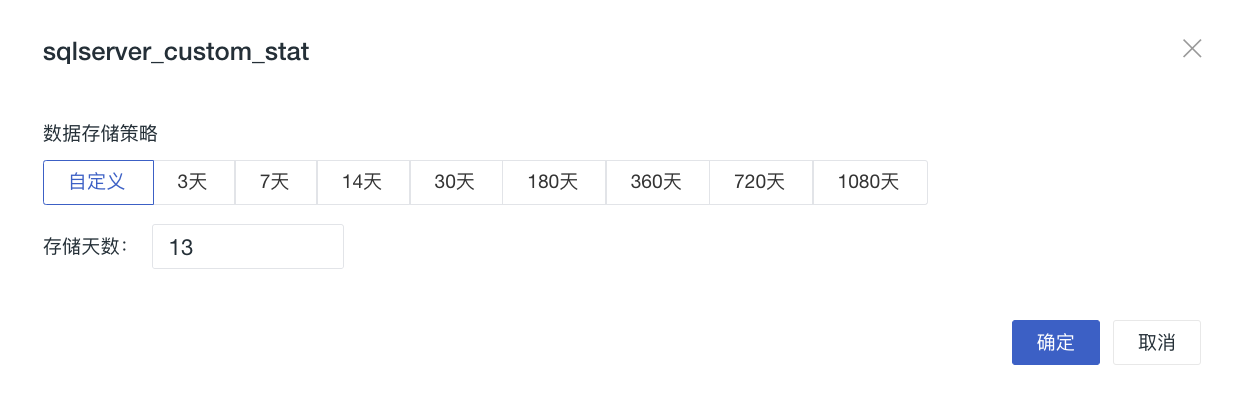
Measurement Custom Settings
Go to Metrics > Metrics Management, and in the options column on the right side of a single measurement, click the icon to select the duration. If not set, it automatically inherits the Global Policy.
Important Limitations
- Permission Control: Only workspace owners can configure;
- Data Risk: Modifying the policy causes immediate and permanent deletion of data under the original policy.
Deployment Plan Special Support
Custom Duration: Supports entering any integer within the range of 1-1,800 days