Chart Configuration
Includes common and advanced configurations applicable to charts.
Common Configurations
Title
-
Title: Set a title name for the chart. After setting, it will be displayed in the upper left corner of the chart. Supports hiding.
-
Description: Add descriptive information for the chart. After setting, an
iprompt will appear after the chart title. If not set, it will not be displayed.
Based on the natural language generation capabilities of the large model provided by TrueWatch, you can use the "Auto-generate" feature to quickly generate semantically fitting titles and descriptions.

Unit
Includes common unit formats for different dimensions, such as data size, time intervals, timestamps, etc.
You can enter custom units in the dropdown box.
Select the metrics included under the current query conditions and enter a custom unit.
About Unit Display for Metric Data
-
Default Unit Display:
-
If the queried data is metric data and you have set a unit for the metric in Metric Management, it will be displayed by default according to the metric's unit with appropriate scaling.
-
If you have no relevant unit configuration in Metric Management, it will be displayed as a numerical value with thousand separators (commas) and appropriate scaling.
-
-
After Configuring a Unit: The custom-configured unit takes priority for scaling display. Metric data supports two options for numerical values:
-
Default Scaling: Units are ten thousand, million, etc. For example, 10,000 is displayed as 10k, 1,000,000 is displayed as 1M. Retains two decimal places.
-
Short Scale: Units are K, M, B. That is, thousand, million, billion, trillion, etc., corresponding to the Chinese context of thousand, million, billion, trillion, etc. For example, 1,000 is 1k, 10,000 is 10k, 1,000,000 is 1M. Retains two decimal places.
-
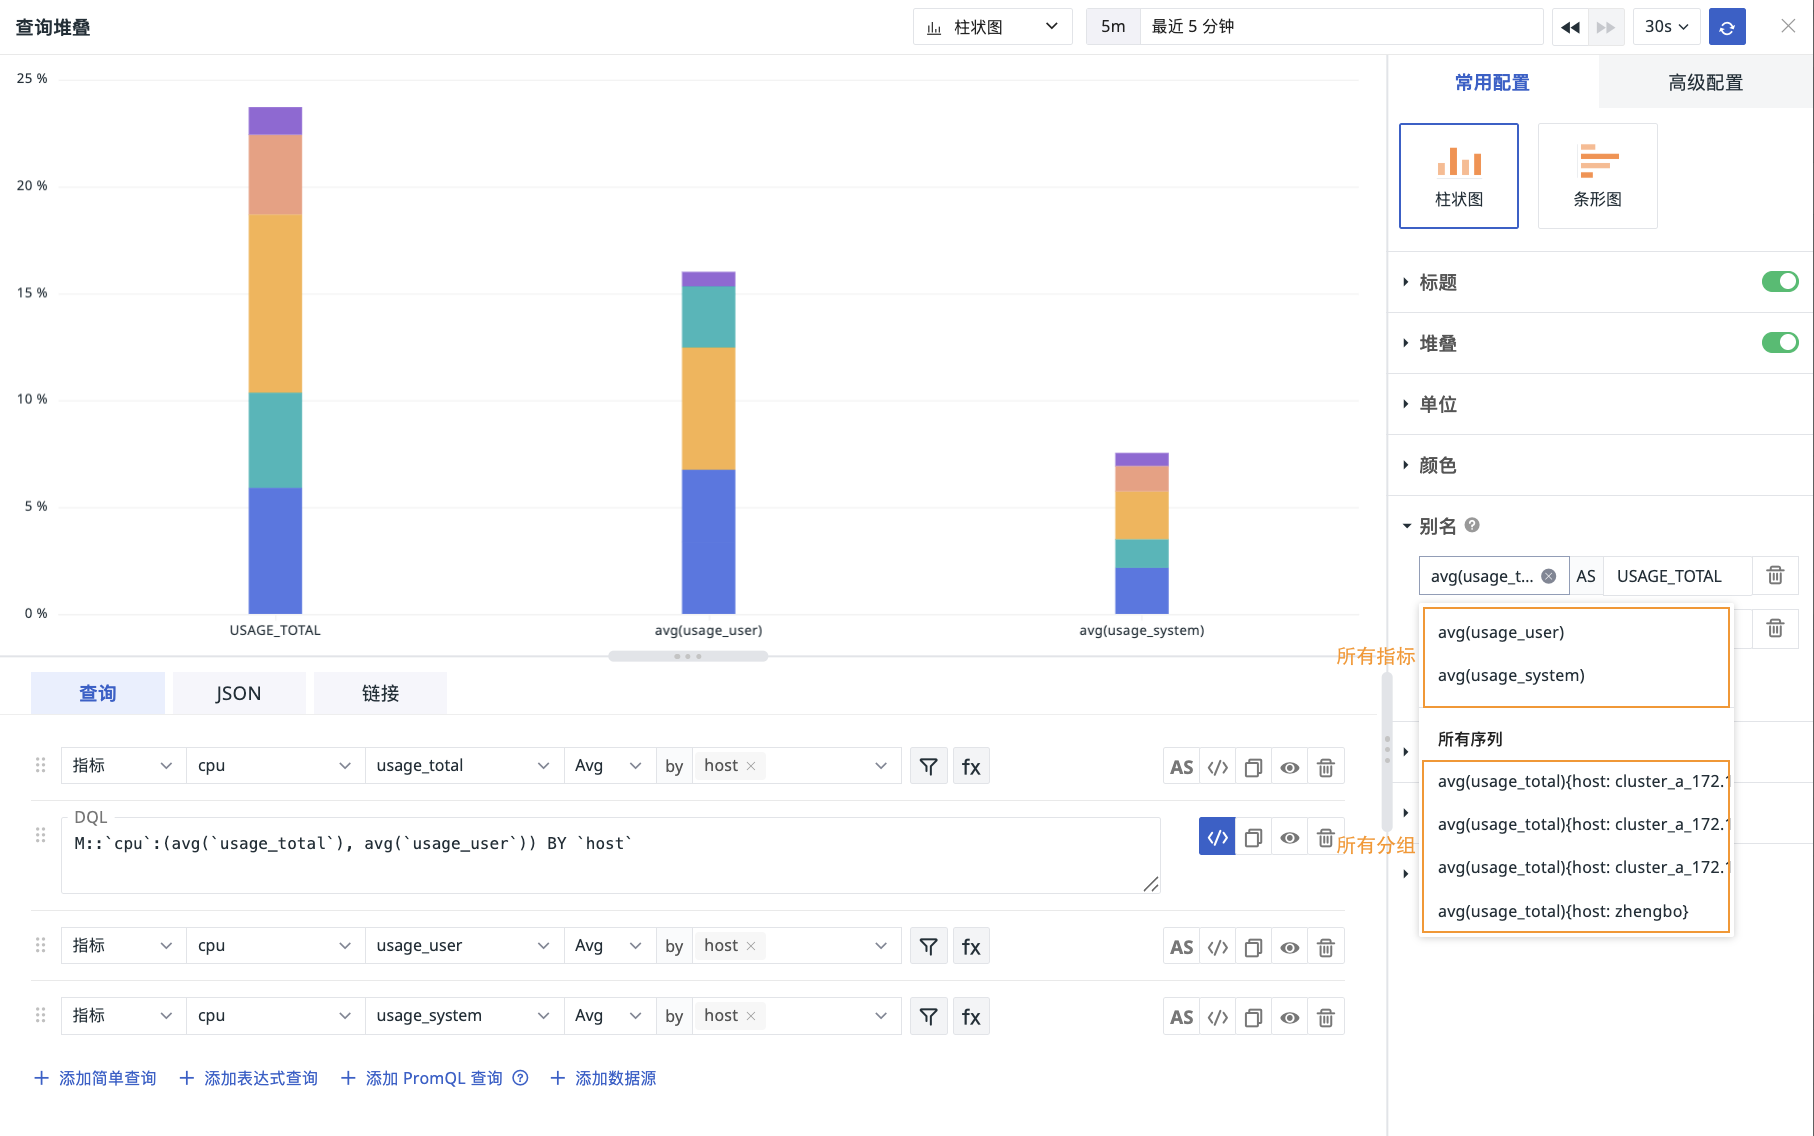
Alias
The system automatically lists all metrics and groups under the current chart query. After adding an alias, the group part of the chart will be dynamically updated based on the alias value. Aliases support using template variables for one-click replacement. For example:
{{tags}}: Replaced with all "tag names" and "tag values".{{host}}: Replaced with the "tag value" ofhost.{{__name__}}: Replaced with all metric names.
Note
- The alias for the metric part is determined by the
ASon the right side of the query statement.
-
If your query contains a
bycondition, all returned legend series will be displayed. -
If you set both the metric part and the group part in the alias, the priority is: group alias > metric alias.
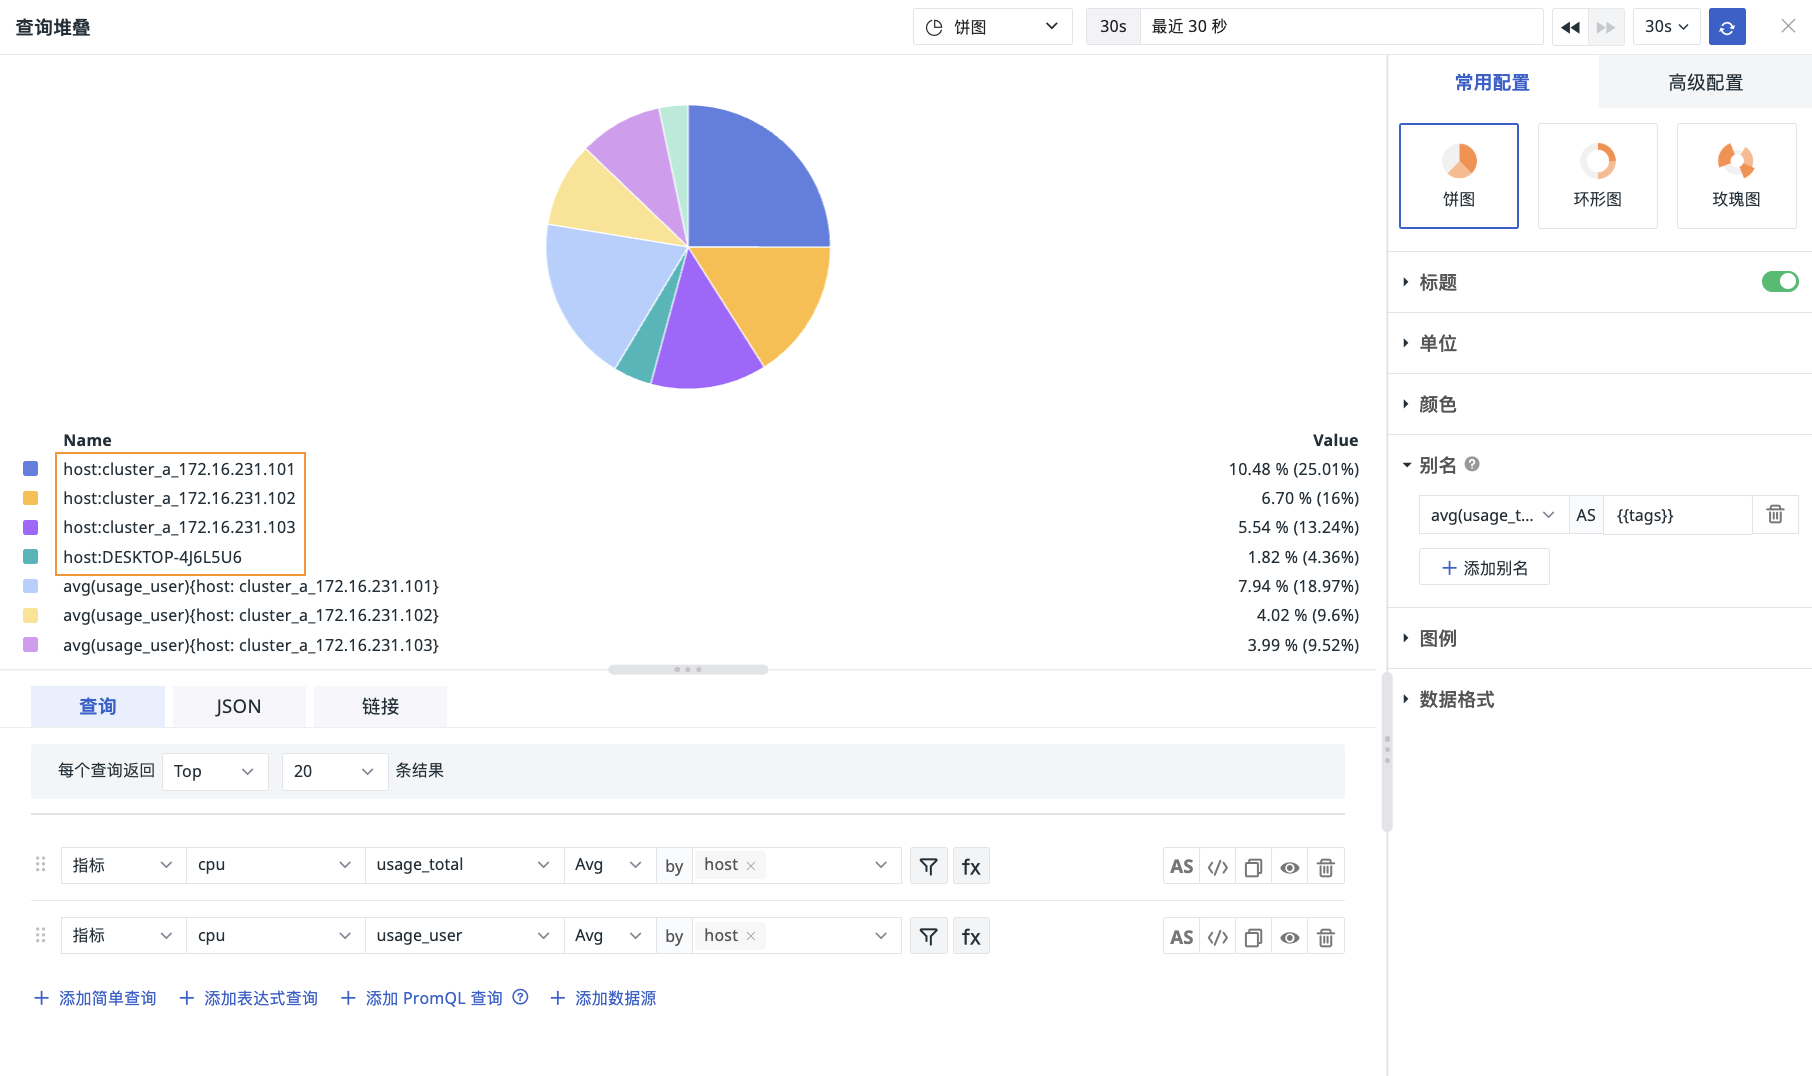
Scenario Example
As shown in the figure below, querying the total CPU usage (usage_total) and user-mode CPU usage (usage_user) of hosts respectively. Based on the former, the alias setting will result in the following scenarios:
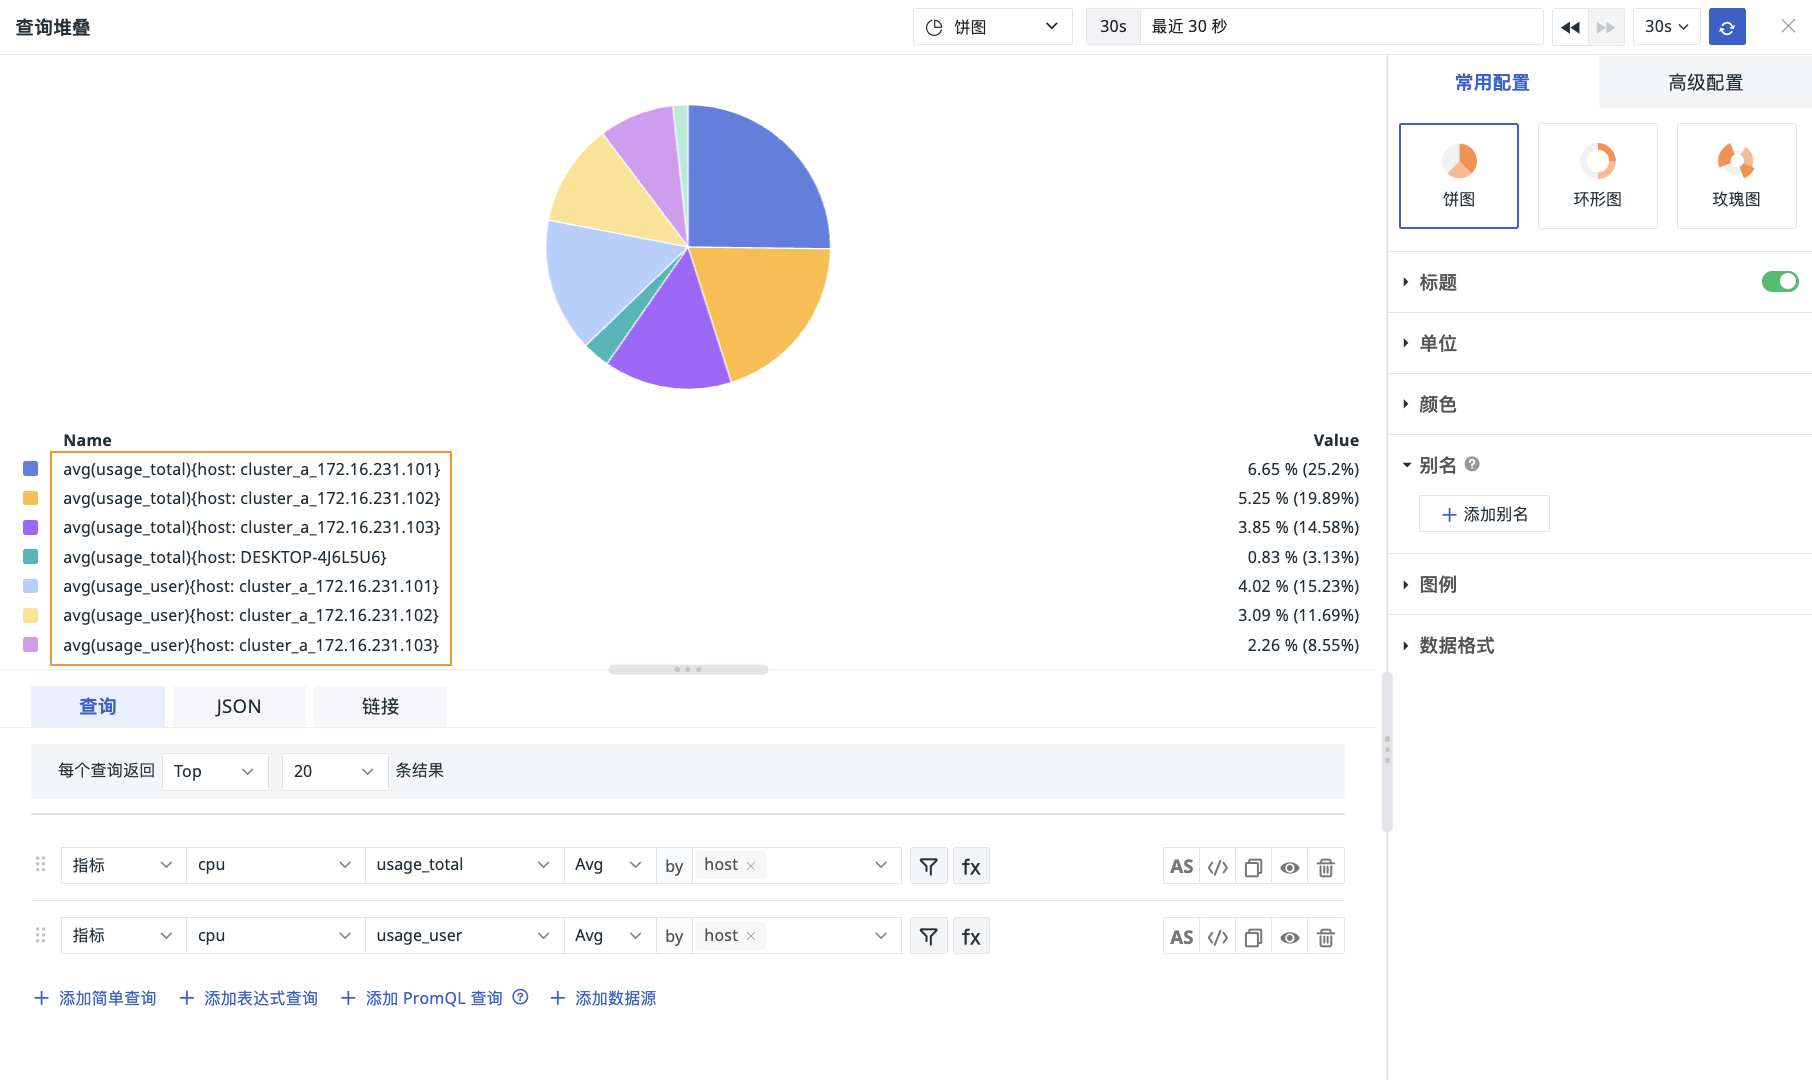
- Effect without alias:
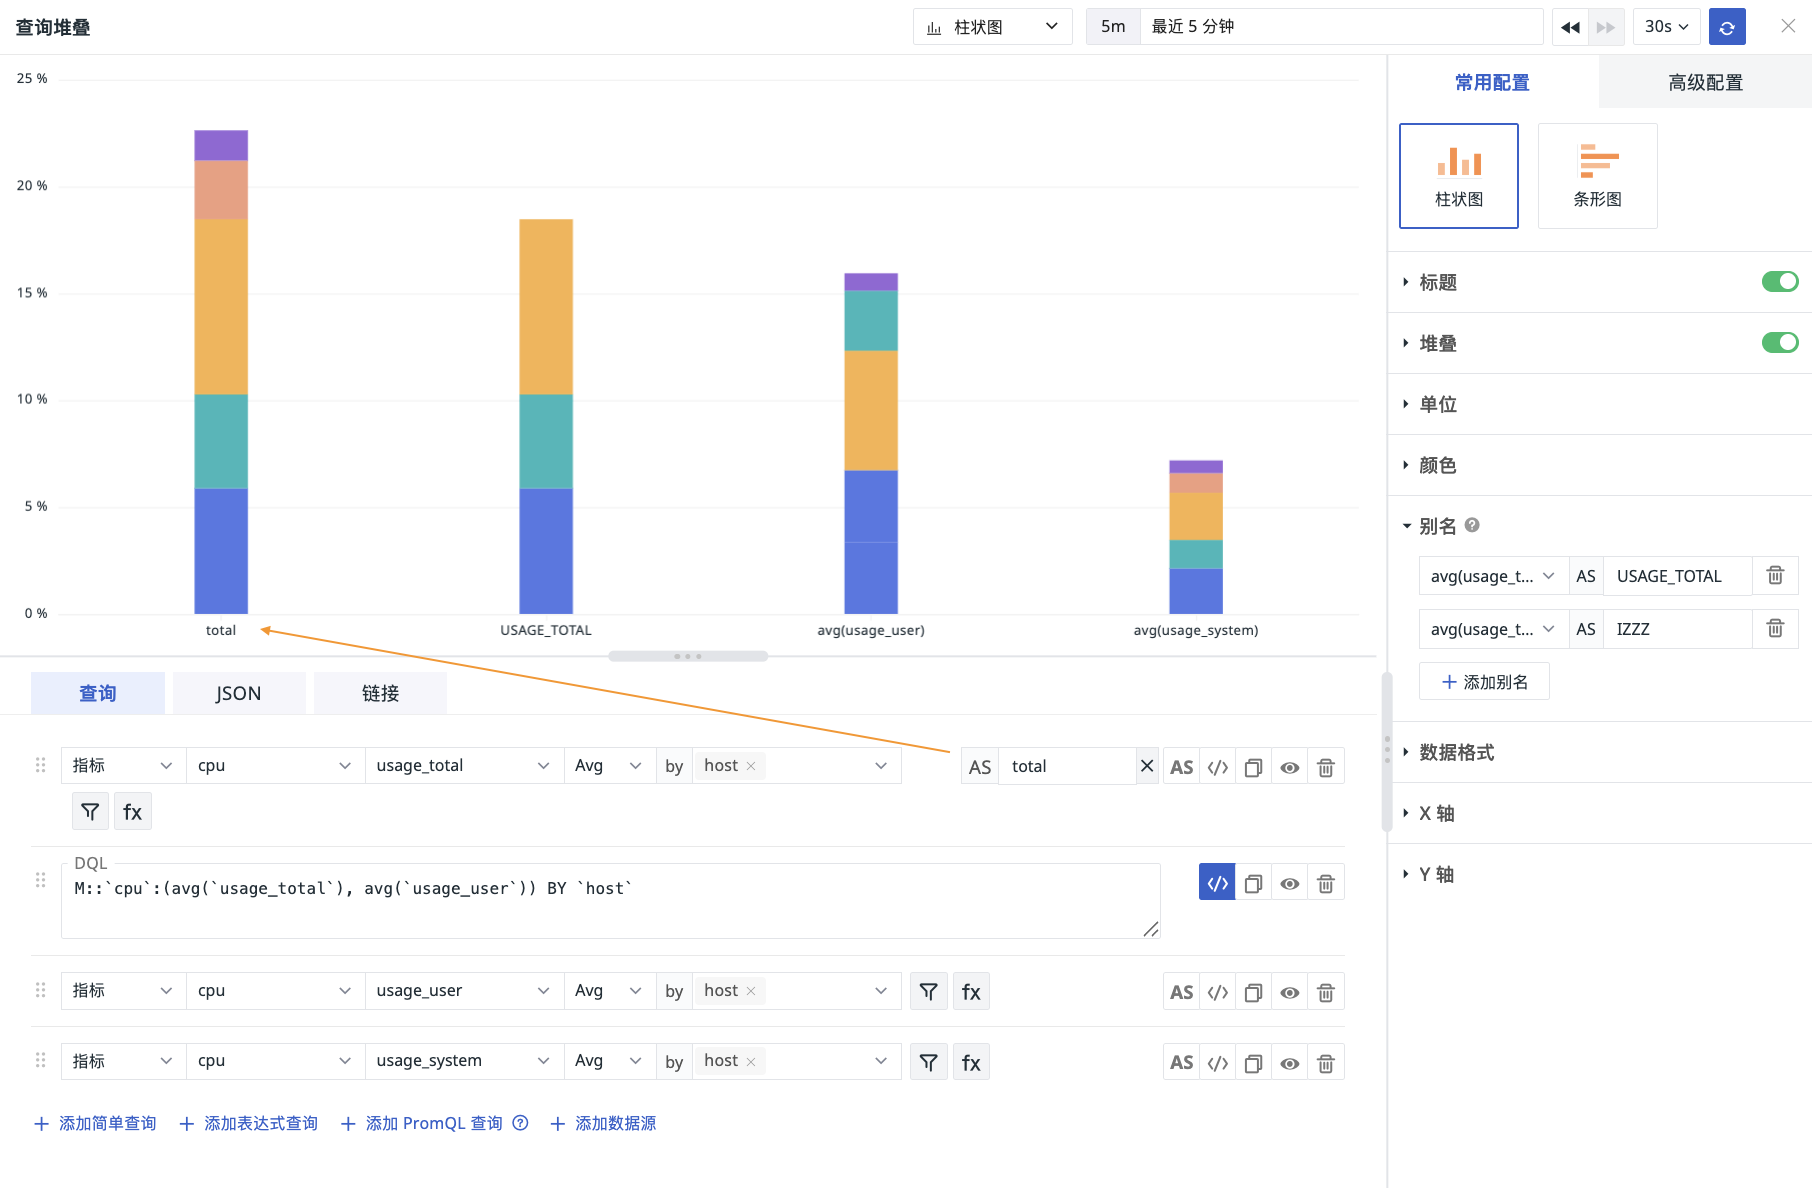
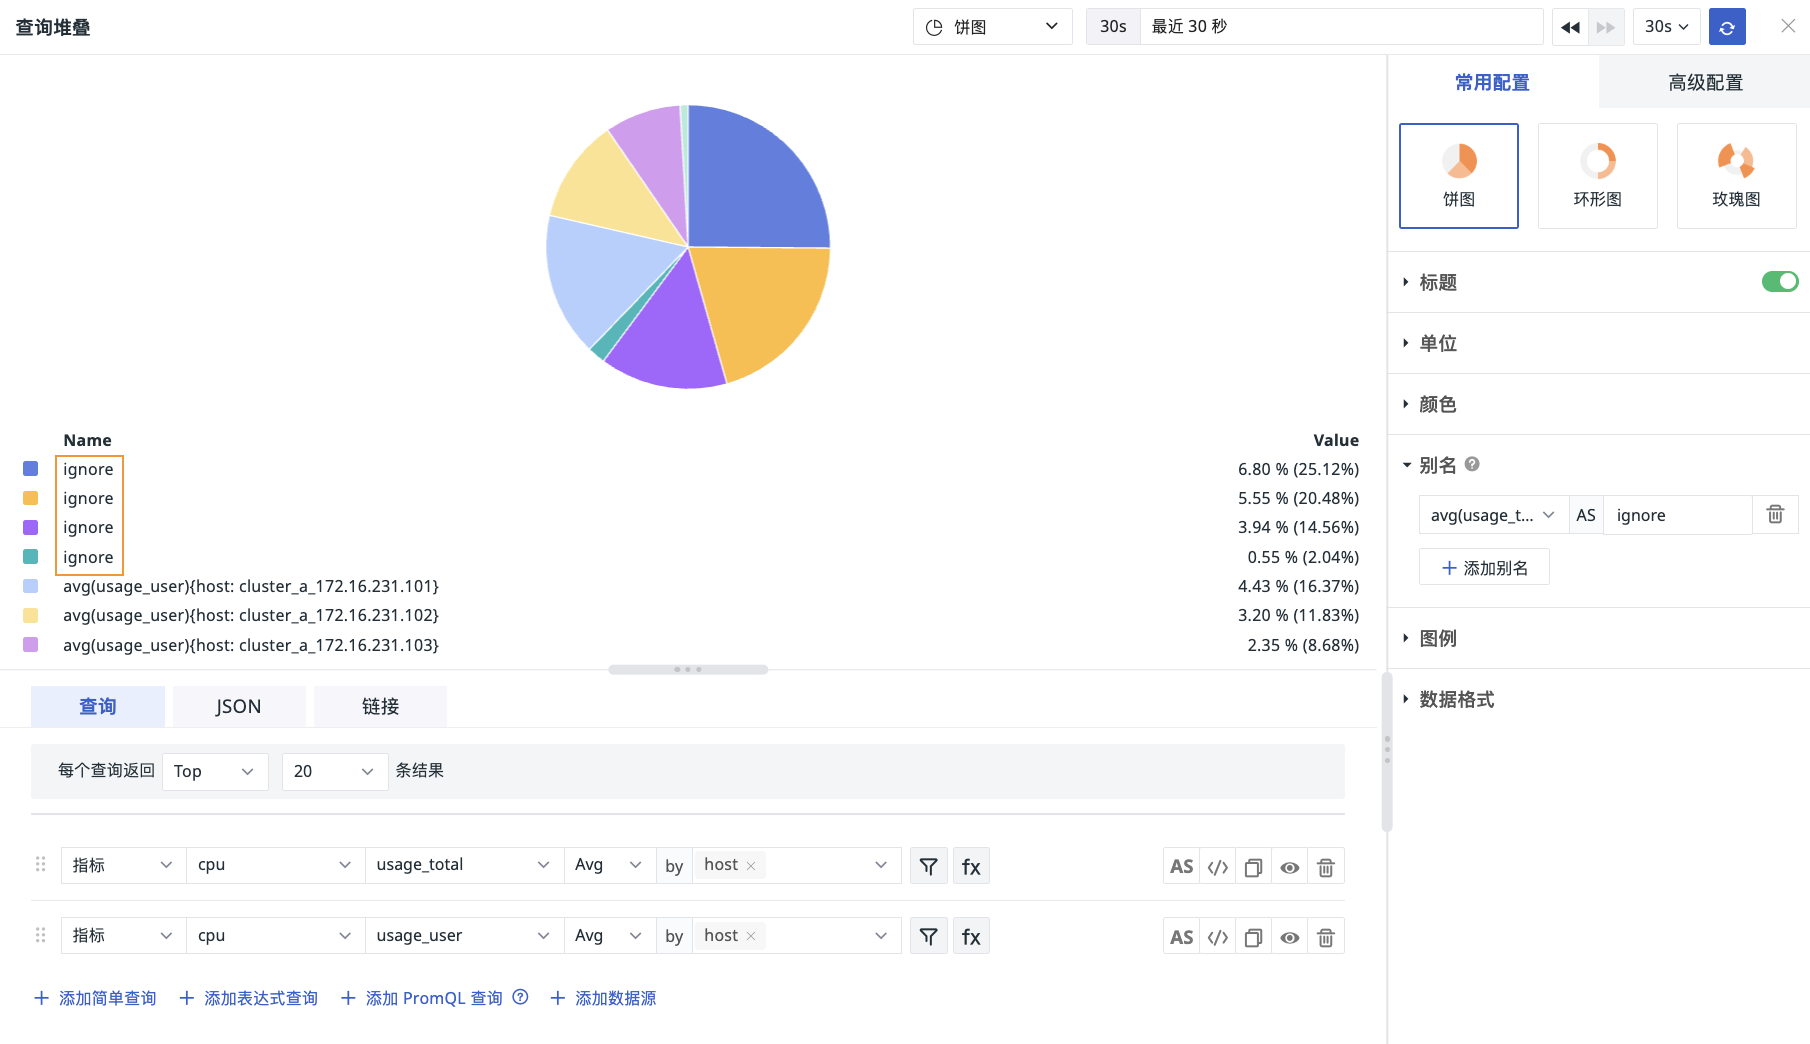
- Effect of inputting pure text for replacement:
- Inputting variable
{{tags}}based on thebycondition:
Legend
Position
Supports choosing to hide the legend, or display it at the bottom or on the right. Clicking on a metric row in the legend can hide/show the corresponding metric.
Display Value
Select the value or calculated value to display in the legend.
The time series chart legend value undergoes secondary aggregation calculation based on the chart query results. Supports selecting Last (last value), First (first value), Avg (average value), Min (minimum value), Max (maximum value), Sum (summation), Count (number of returned points).
As shown in the figure below: First represents the first value of the current time series chart query result, Last is the last value of the current time series chart query result. Clicking the legend value supports ascending/descending sorting.

Note
Avg, Sum, Count display different results depending on the selected time interval (original interval and automatic alignment).
Data Format
- Decimal Places: Can choose 0, 1, 2, 3 decimal places or full precision.
- Thousand Separator: Enabled by default. After disabling, the original value will be displayed without separators.
Dashboard chart query results support automatic addition of thousand-separator format for data display. If a unit is set, the data format is displayed according to the set unit.
After setting, the data can be displayed in thousand-separator format in preview. If a unit is set, it will be displayed in the unit format.
- Display with thousand-separator data format:

- Display with set data format:

Advanced Configurations
Lock Time
Fixes the time range for the current chart's query data, not restricted by the global time widget. After successful setting, the user-set time will appear in the upper right corner of the chart, such as "xx minutes", "xx hours", "xx days". Assuming a locked time interval of 30 minutes, even if the time widget in the upper right corner is adjusted, the current chart will still only display data from the last 30 minutes.
Rule Mapping
Set metric ranges and corresponding background colors and font colors for different columns. Metrics within the range will be displayed according to the set style.
Set metric ranges and mapping values. When a metric value falls within the set data range, it will be displayed as the corresponding mapping value.
When a metric value satisfies multiple settings simultaneously, it will be displayed with the style of the last satisfied condition.
When setting value mapping, both "Display as" and "Color" are not mandatory/required fields:
- Display as: Default is empty, meaning no mapping value display.
- Color: Default is empty, meaning no color mapping, displaying its original color.
Field Mapping
In actual business scenarios, if the field to be queried is inconsistent with the field displayed on the front end, you can enable field mapping in the chart. Works with the object mapping function of view variables. Default is off.
After enabling field mapping, the chart displays the queried grouping field and the corresponding mapped field. Grouping fields without specified mapping are not displayed.
Workspace Authorization
After enabling, you can query data from external workspaces under the current chart in the current workspace.
Below the chart, you can select the target workspace for querying from the dropdown box of authorized workspaces.
Data Sampling
Only for workspaces using the Doris log data engine.
When enabled, sampling queries will be performed on data other than "metrics". The sampling rate is not fixed and is dynamically adjusted based on the data volume.
For more details, refer to Data Sampling Feature Technical Guide.
Time Offset
Since non-time series data has a query delay of at least 1 minute after ingestion. When querying relative time, data from the last few minutes may not have been collected yet, leading to missing data.
After enabling time offset, when querying a relative time interval, the actual query time range is shifted forward by 1 minute to prevent empty data retrieval due to ingestion delay. For example: Current time is 12:30, querying data from the last 15 minutes. After enabling time offset, the actual query time is: 12:14-12:29.
Note
- This setting only takes effect for relative time. If the query time interval is an "absolute time range", time offset does not take effect.
- For charts with time intervals, such as time series charts, if the set time interval exceeds 1min, time offset does not take effect. It only takes effect when the interval is <= 1m. For charts without time intervals, such as overview charts, bar charts, etc., time offset remains effective.
Sampling Pre-check
After enabling, the system will first start the "Sampling Pre-check" function, automatically estimating the data volume after filtering. If the data volume reaches or exceeds the preset lower sampling threshold, the system will automatically trigger and execute the sampling process based on the ratio between the threshold and the target data volume. If the data volume is below this lower limit, no sampling is performed, and all data is retained.