Use Cases
Prerequisites
You have already created charts in the dashboard and now need to add links to the charts.
Using Variables
Taking jumping to other views as an example:
Step 1: Add Chart Link
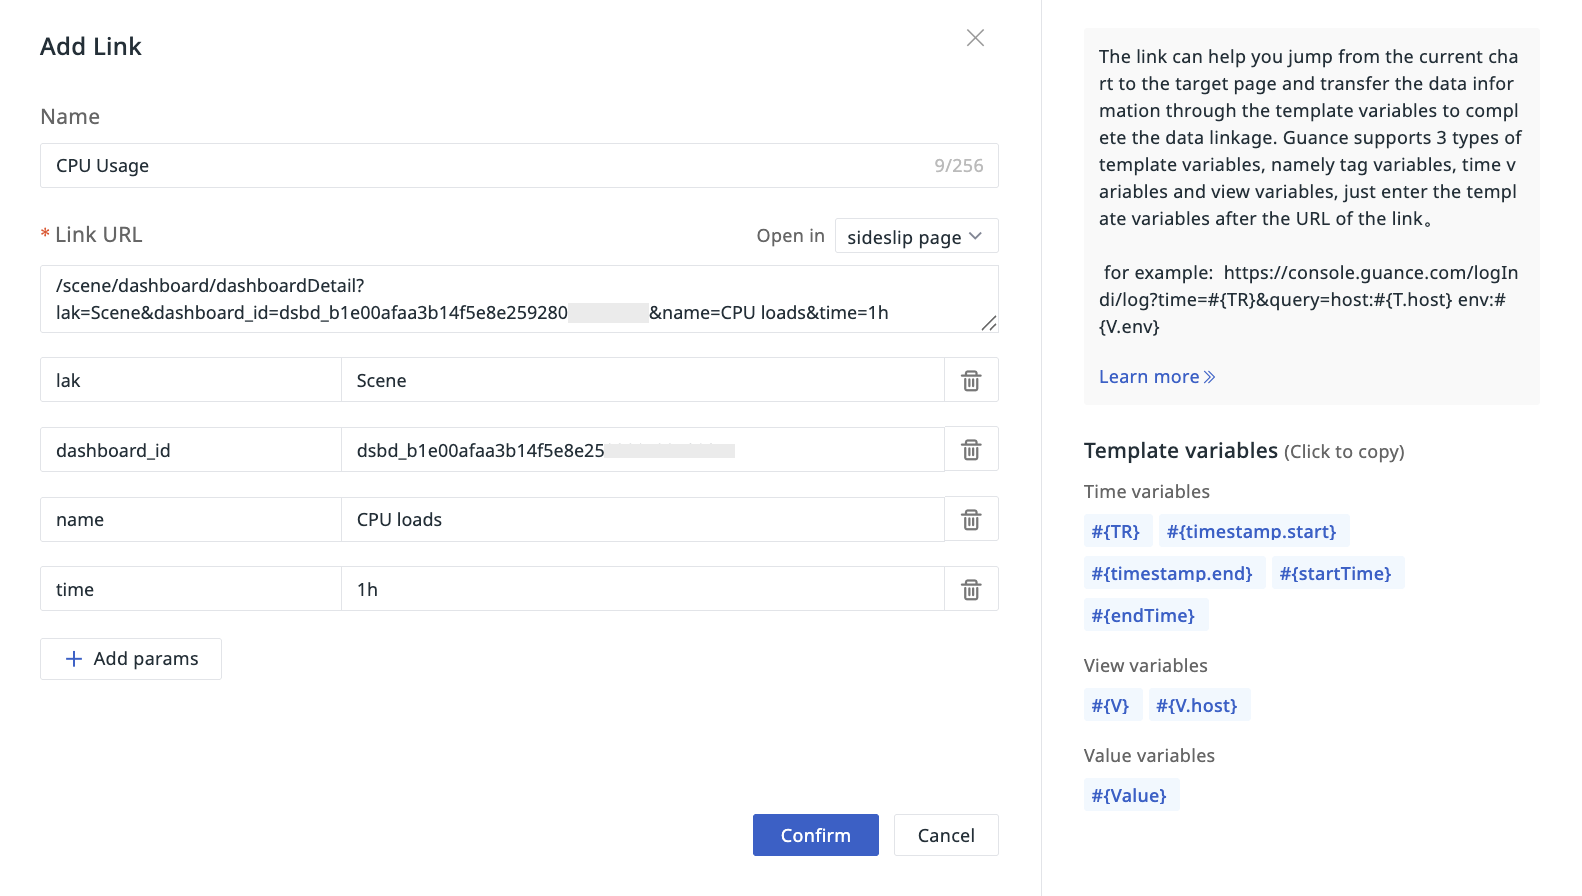
- Define the name as "CPU Usage".
- Configure the link address based on the preset links and parameters. As shown in the figure, define the parameters:
dashboard_idasdsbd_b1e00afaa3b14f5e8e259280c8*****nameasCPU loads- Add the time variable
#{TR}to the link address, and add the parametertime, defined as1h(last 1 hour)
- Select the opening method as "Side Slide".
- Confirm.
Step 2: Link Jump Verification
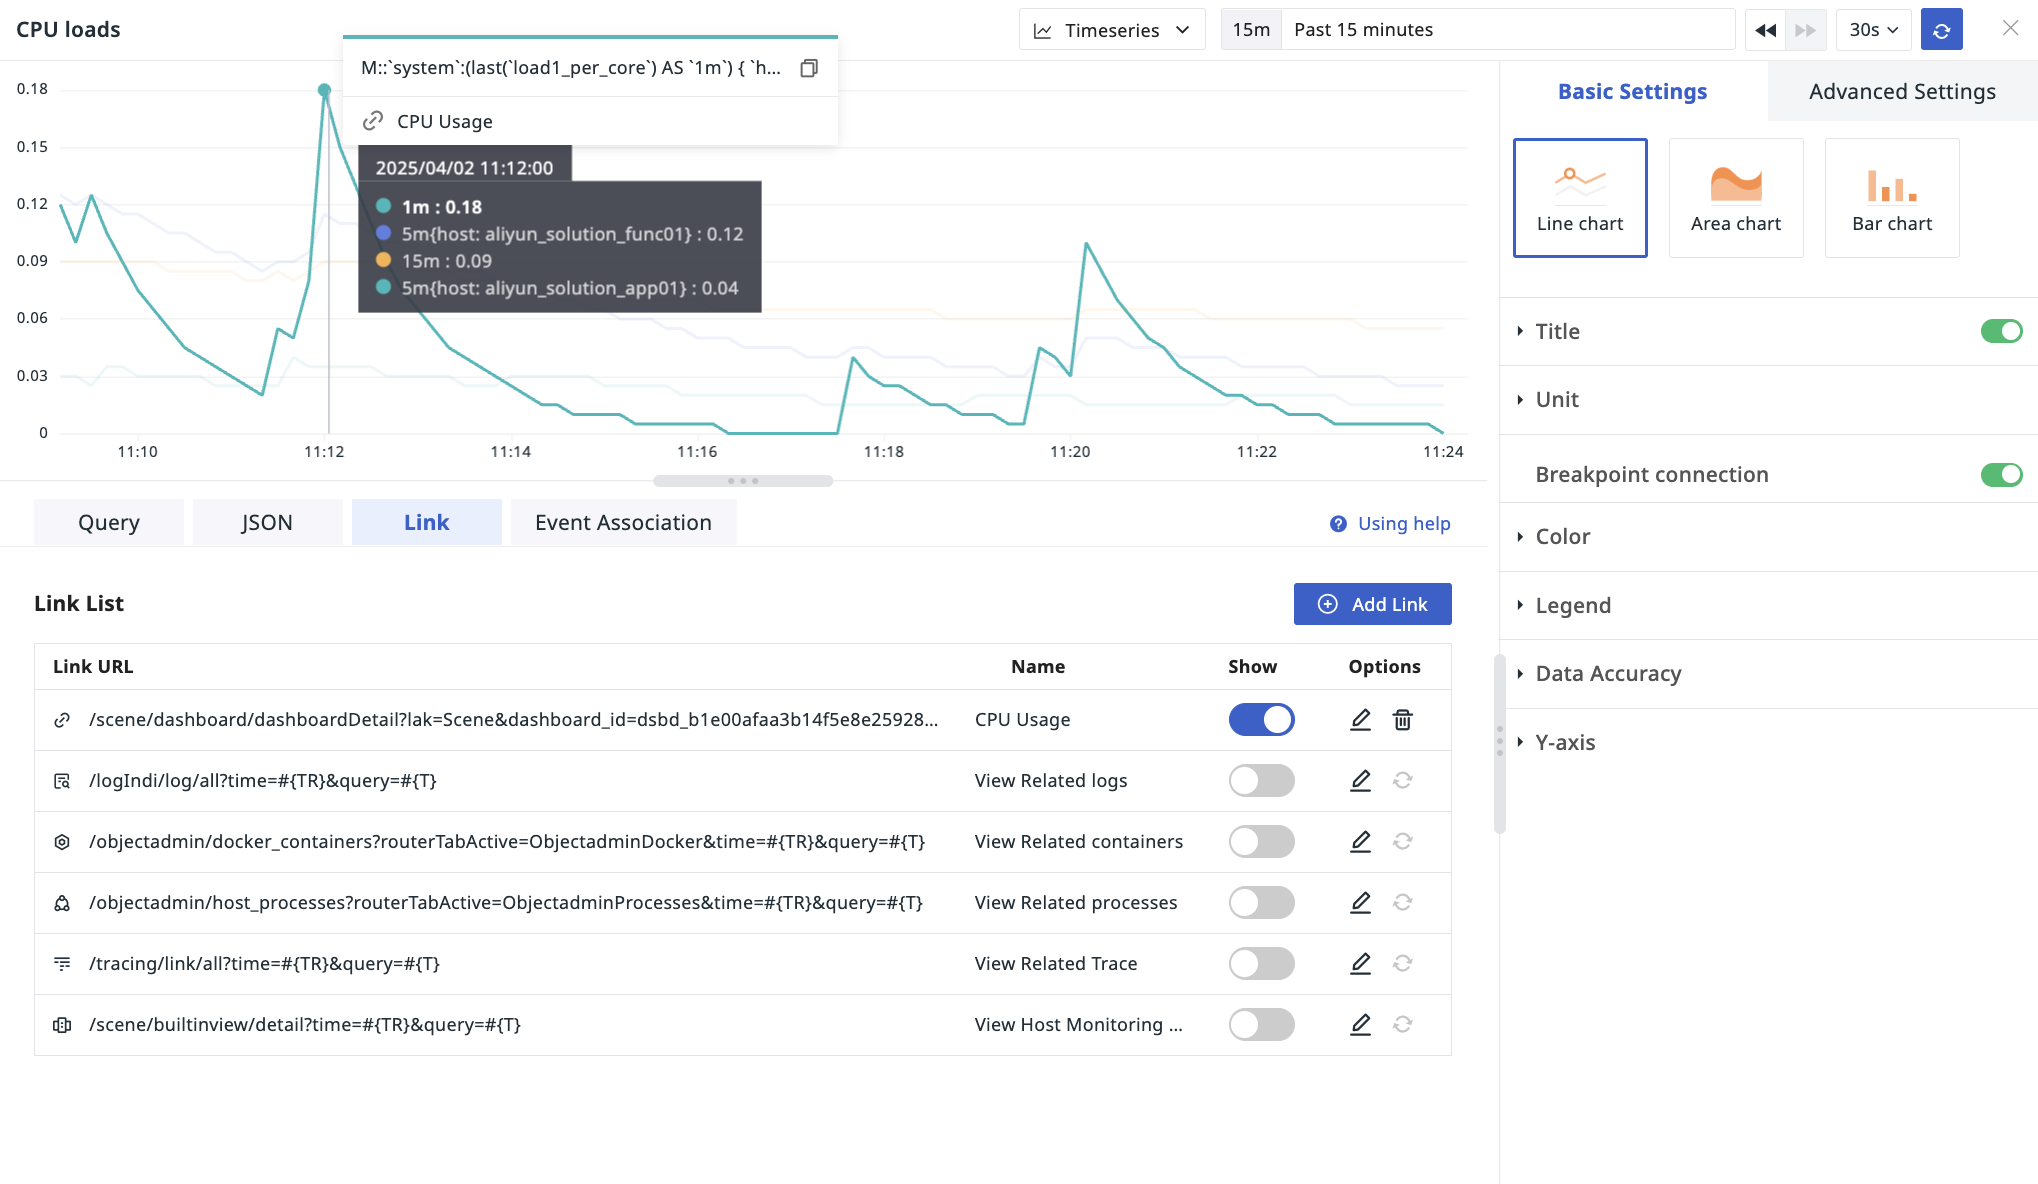
- After the link is added, select a specific time point in the chart.
- Click the configured "CPU Usage" link.
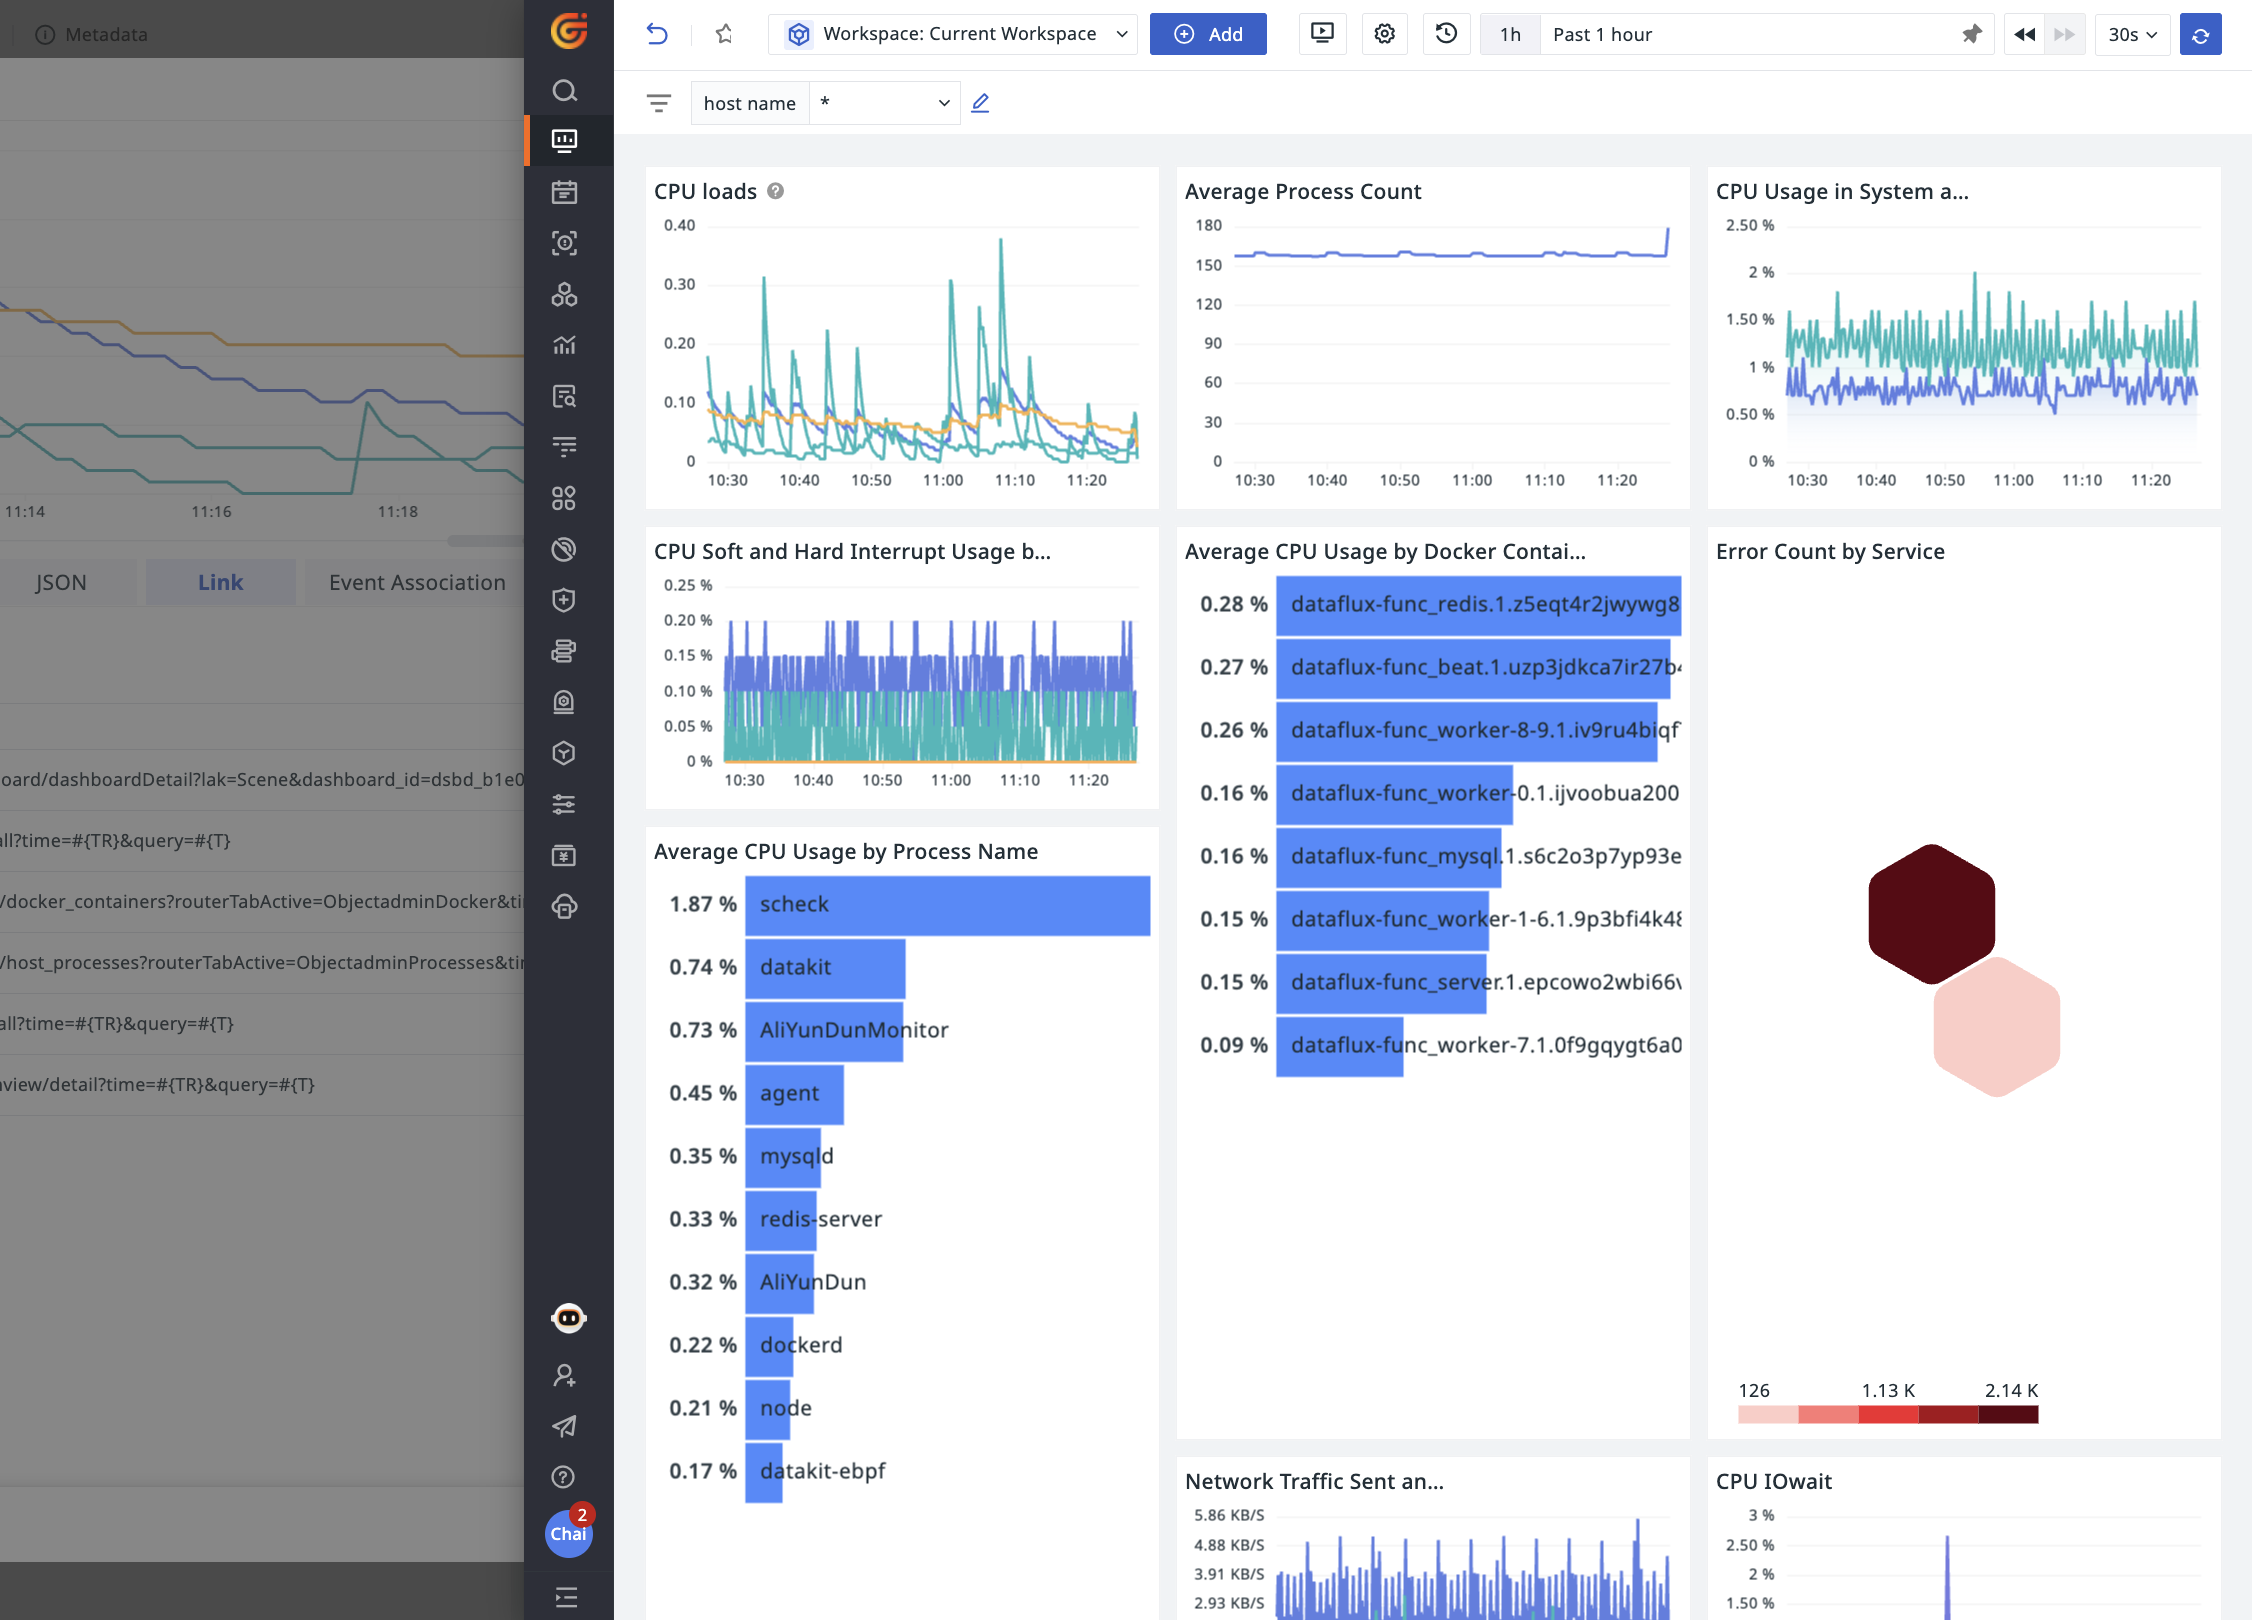
- The target view opens in a side slide.
Not Using Variables
Taking jumping to external help documentation as an example:
Step 1: Add Chart Link
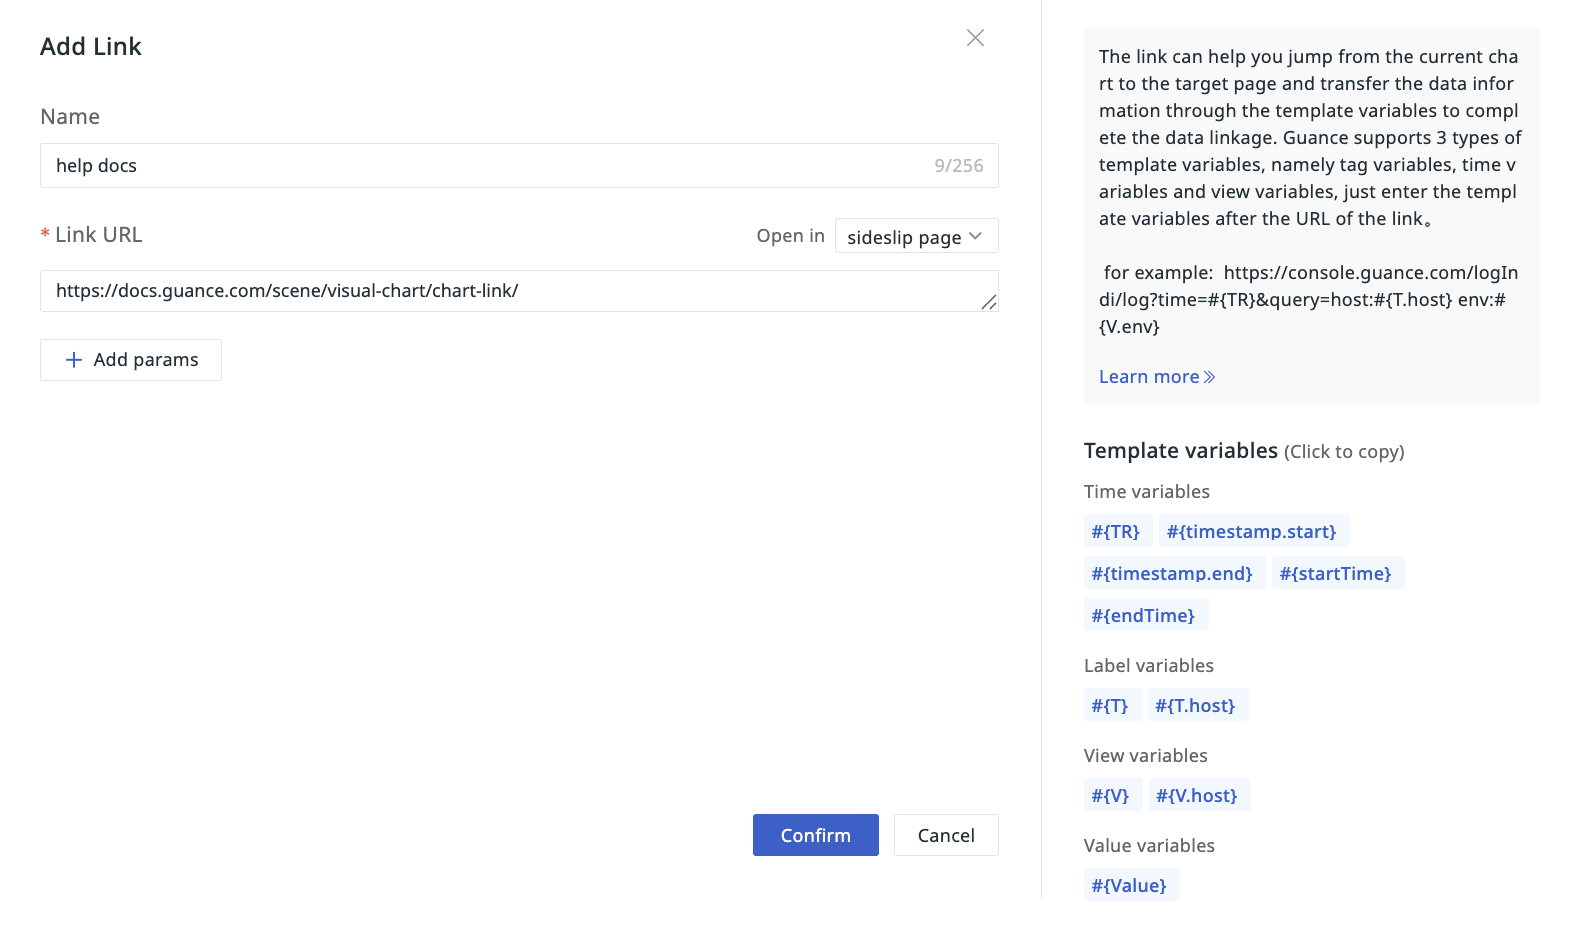
- Define the name as "help docs".
- Directly paste the external URL you want to jump to. As shown in the figure:
https://docs.truewatch.com/scene/visual-chart/chart-link/. - Select the opening method as "Side Slide".
- Confirm.
Step 2: Link Jump Verification
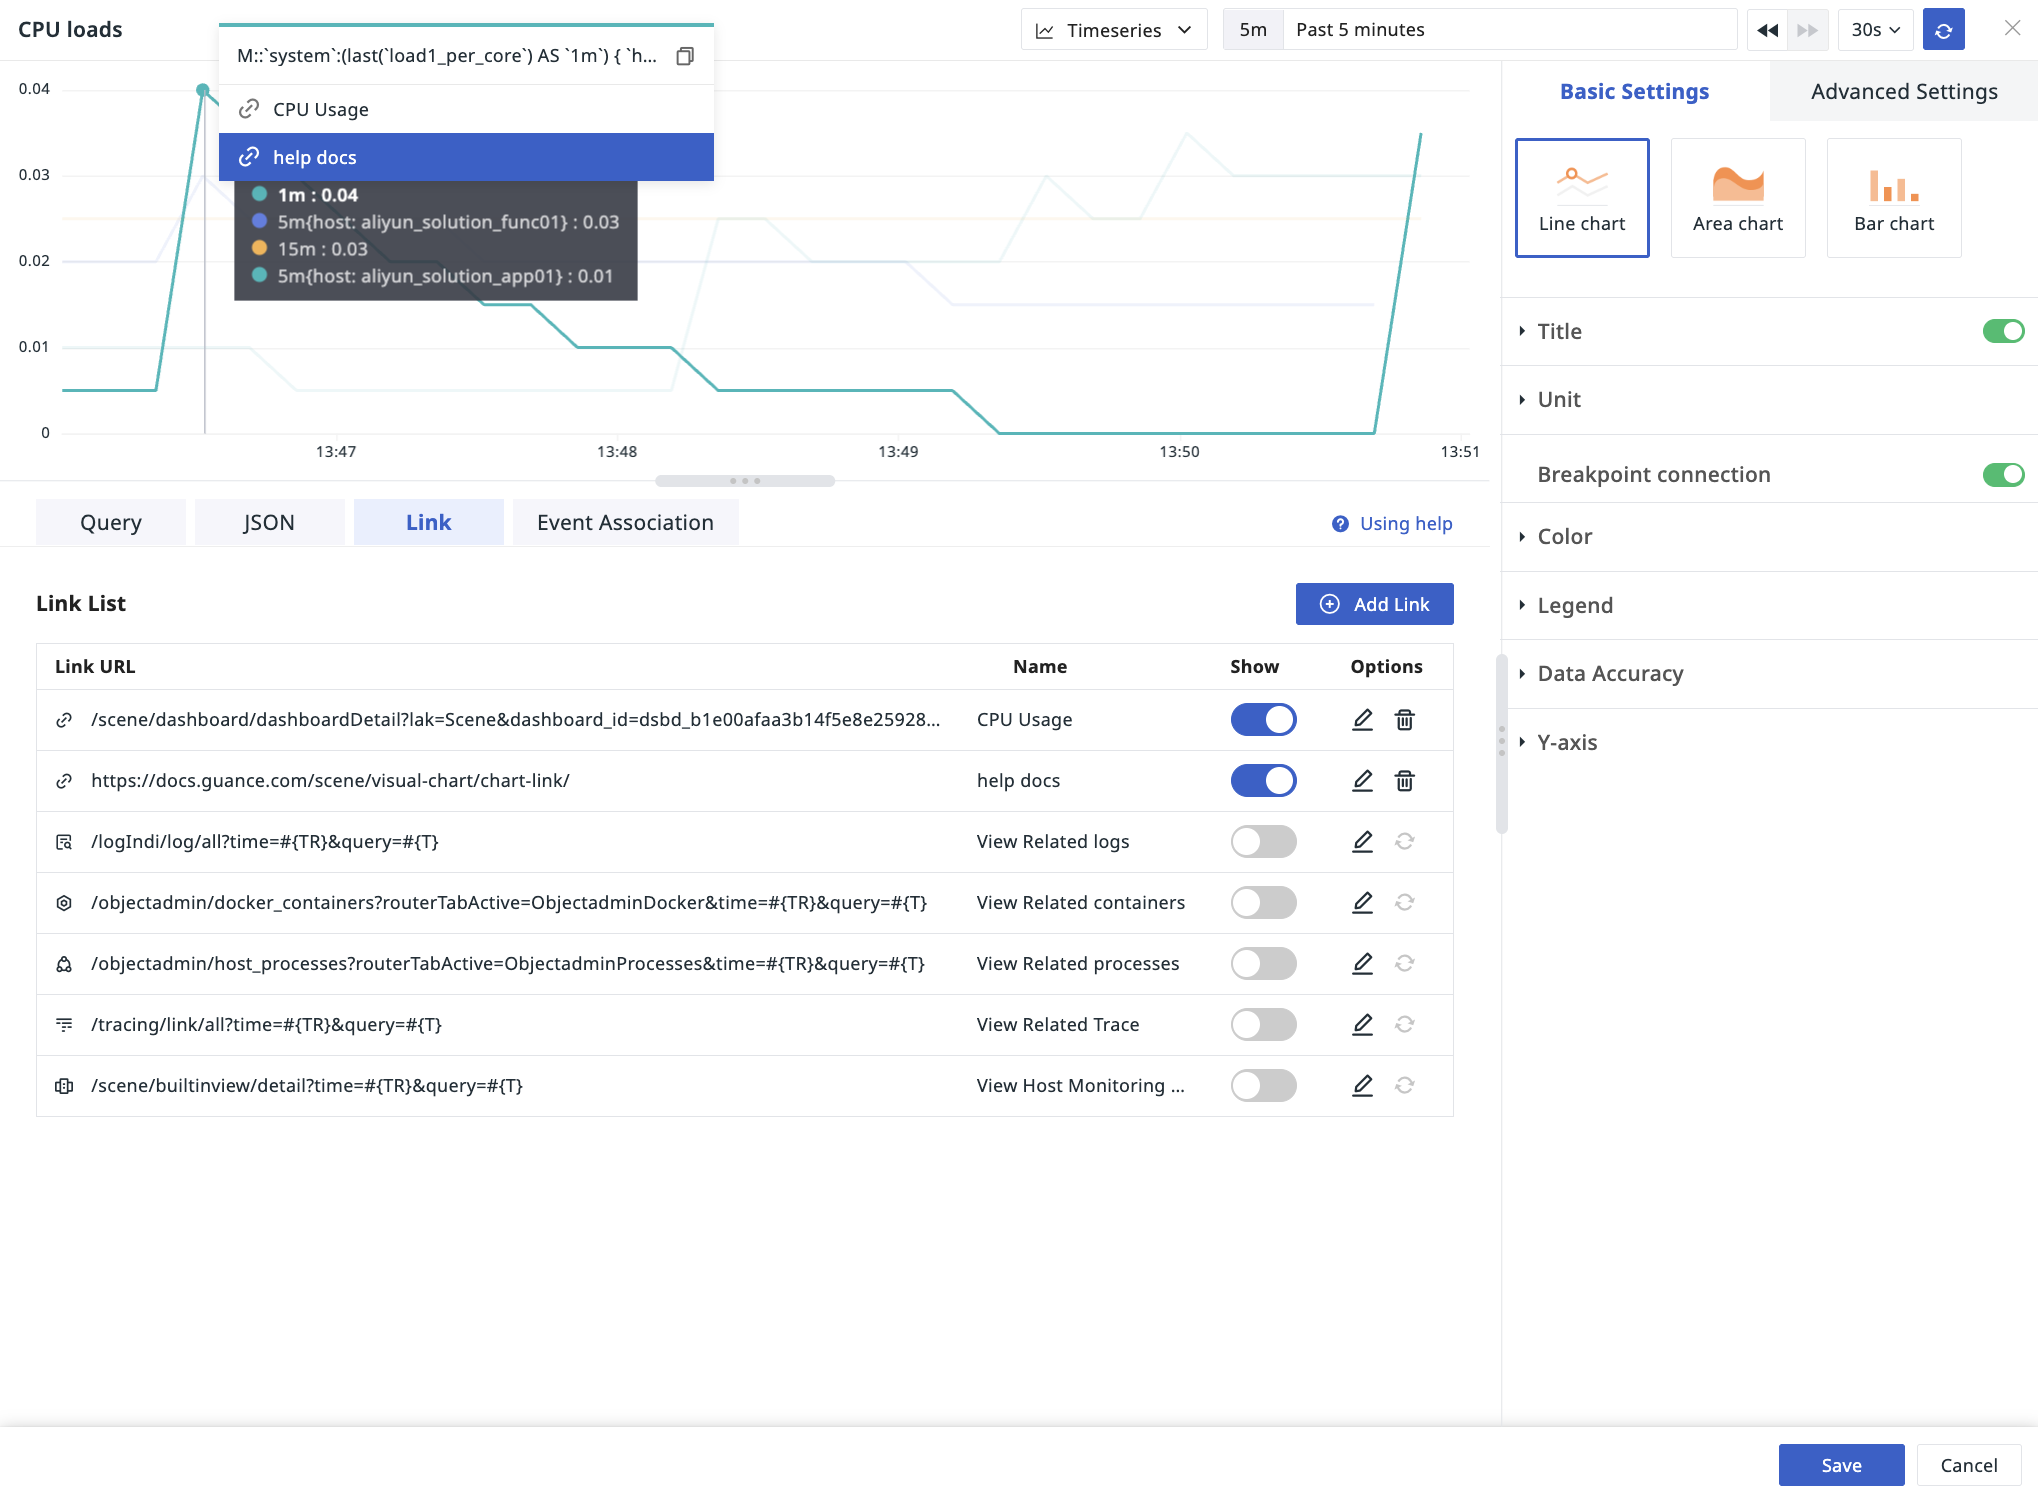
- After the link is added, select a specific time point in the chart.
- Click the configured "help docs" link.
- The target link opens in a side slide.