DDTrace
The DataKit ddtrace collector is a DataDog Trace protocol receiver. A DDTrace SDK or Java Agent in your application sends trace payloads to DataKit over HTTP; DataKit then parses, processes, and uploads them. The collector neither installs an SDK in the application nor instruments application code for you.
The data path is:
application code → DDTrace SDK / Java Agent → DataKit HTTP receiver → TrueWatch
Traces, profiling data, and runtime/JMX metrics use different receivers:
- This collector receives traces through the DataKit HTTP port, normally
9529. - Profiling requires the separate Profiling collector.
- JMX and runtime metrics sent through DogStatsD require the separate StatsD collector, normally on port
8125.
Before You Begin
- Install DataKit, enable this collector, and instrument the application with the SDK or Agent for its language.
- Ensure that the application can reach DataKit. DataKit listens on
localhost:9529by default. If the application is on another host or Pod, adjust the HTTP listener and restrict access with firewalls, a Kubernetes Service, or NetworkPolicy. - Explicitly configure the trace destination in the application, for example
DD_AGENT_HOST=<datakit-host>andDD_TRACE_AGENT_PORT=9529. The common upstream Datadog Agent default is8126; do not rely on a default and do not confuse the trace port with the StatsD port8125. - Set stable
DD_SERVICE,DD_ENV, andDD_VERSIONvalues. They determine the service, environment, and version shown in the tracing UI.
Language-Specific Setup
-
Python
SDK · Documentation · Example
-
Java
SDK · Documentation · Example
-
Ruby
SDK · Documentation · Example
-
Golang
SDK · Documentation · Example
-
PHP
SDK · Documentation · Example
-
NodeJS
SDK · Documentation · Example
-
C++ (Legacy Compatibility)
SDK · Documentation · Example
-
.NET
Info
TrueWatch provides an extended Java Agent for selected frameworks and more granular collection. These extensions apply only when you use the TrueWatch JAR. Review the Java extension guide and its changelog, especially the configuration and data-exposure warnings.
Configuration
This section configures the DataKit receiver. Configure the SDK's destination, service identity, and sampling separately in the application's startup options or environment variables; see the language-specific guide.
Go to the conf.d/samples directory under the DataKit installation directory, copy ddtrace.conf.sample and name it ddtrace.conf. Examples are as follows:
[[inputs.ddtrace]]
  ## DDTrace Agent endpoints register by version respectively.
  ## Endpoints can be skipped listen by remove them from the list.
  ## NOTE: DO NOT EDIT.
  endpoints = ["/v0.3/traces", "/v0.4/traces", "/v0.5/traces"]

  ## customer_tags selects span meta and metrics keys to promote.
  ## String meta values are added as tags, while numeric metrics values are added as fields.
  ## All . will replace to _ ,like this : "project.name" to send to center is "project_name"
  # customer_tags = ["sink_project", "custom_dd_tag", "reg:key_*"]

  ## Keep rare tracing resources list switch.
  ## If some resources are rare enough(not presend in 1 hour), those resource will always send
  ## to data center and do not consider samplers and filters.
  # keep_rare_resource = false

  ## By default every error presents in span will be send to data center and omit any filters or
  ## sampler. If you want to get rid of some error status, you can set the error status list here.
  # omit_err_status = ["404"]

  ## compatible otel: It is possible to compatible OTEL Trace with DDTrace trace.
  ## make span_id and parent_id to hex encoding.
  # compatible_otel=true

  ##  It is possible to compatible B3/B3Multi TraceID with DDTrace.
  # trace_id_64_bit_hex=true

  ## api:/telemetry/proxy/api/v2/apmtelemetry is collect jvm metadata.
  ## data is: app-dependencies-loaded,app-client-configuration-change,app-integrations-change ...
  ## default is true.
  # apmtelemetry_route_enable = true

  ## When true, the tracer generates 128 bit Trace IDs,
  ## and encodes Trace IDs as 32 lowercase hexadecimal characters with zero padding.
  ## default is true.
  # trace_128_bit_id = true

  ## delete trace message
  # del_message = true

  ## max spans limit on each trace. default 100000 or set to -1 to remove this limit.
  # trace_max_spans = 100000

  ## max trace body(Content-Length) limit. default 32MiB or set to -1 to remove this limit.
  # max_trace_body_mb = 32

  ## Rejected sampling priorities that bypass DDTrace's early drop decision.
  ## Supported values are -3, -1, and 0. Empty by default to preserve the current behavior.
  ## Set it to [0] to bypass the early drop for priority 0. A bypassed trace still goes
  ## through subsequent DataKit filters and samplers.
  # sampling_priority_drop_excludes = []

  ## tracing_metric_enable: trace_hits trace_hits_by_http_status trace_latency trace_errors trace_errors_by_http_status trace_apdex.
  ## Extract the above metrics from the collection traces.
  # tracing_metric_enable = true

  ## Blacklist of metric tags: There are many labels in the metric: "tracing_metrics".
  ## If you want to remove certain tag, you can use the blacklist to remove them.
  ## By default, it includes: source,span_name,env,service,status,version,resource,http_status_code,http_status_class
  ## and "customer_tags", k8s related tags, and others service.
  # tracing_metric_tag_blacklist = ["resource","operation","tag_x"]

  ## Whitelist of metric tags: There are many labels in the metric: "tracing_metrics".
  # tracing_metric_tag_whitelist = []

  ## Collect the QPS of spans that contain http.method or http.status_code.
  ## The points use one-second buckets and are reported every 60 seconds.
  # tracing_metric_qps_enable = false

  ## Tags used to group QPS. Avoid high-cardinality tags such as http_url and user ID.
  # tracing_metric_qps_tags = ["service", "env", "version", "span_kind", "http_method", "http_status_code"]

  ## Maximum distinct QPS tag combinations kept in one reporting window.
  ## Additional combinations are aggregated into qps_overflow=true.
  ## If metric output remains blocked, each shard retains at most 120 second buckets.
  ## Older data is counted by datakit_input_ddtrace_qps_dropped_spans_total.
  # tracing_metric_qps_max_series = 1000

  ## Ignore tracing resources map like service:[resources...].
  ## The service name is the full service name in current application.
  ## The resource list is regular expressions uses to block resource names.
  ## If you want to block some resources universally under all services, you can set the
  ## service name as "*". Note: double quotes "" cannot be omitted.
  # [inputs.ddtrace.close_resource]
  #   service1 = ["resource1", "resource2", ...]
  #   service2 = ["resource1", "resource2", ...]
  #   "*" = ["close_resource_under_all_services"]
  #   ...

  ## Sampler config uses to set global sampling strategy.
  ## sampling_rate used to set global sampling rate.
  # [inputs.ddtrace.sampler]
  #   sampling_rate = 1.0

  # [inputs.ddtrace.tags]
  #   key1 = "value1"
  #   key2 = "value2"
  #   ...

  ## Threads config controls how many goroutines an agent cloud start to handle HTTP request.
  ## buffer is the size of jobs' buffering of worker channel.
  ## threads is the total number fo goroutines at running time.
  # [inputs.ddtrace.threads]
  #   buffer = 100
  #   threads = 8

  ## Storage config a local storage space in hard dirver to cache trace data.
  ## path is the local file path used to cache data.
  ## capacity is total space size(MB) used to store data.
  # [inputs.ddtrace.storage]
  #   path = "./ddtrace_storage"
  #   capacity = 5120
After configuration, restart DataKit to take effect.
You can enable the collector by injecting collector configuration via ConfigMap or configuring ENV_DATAKIT_INPUTS.
You can also modify configuration parameters via environment variables (you need to add the collector to ENV_DEFAULT_ENABLED_INPUTS as a default collector):
-
ENV_INPUT_DDTRACE_ENDPOINTS
Agent endpoints
Type: JSON
input.conf:
endpointsExample:
'["/v0.3/traces", "/v0.4/traces", "/v0.5/traces"]' -
ENV_INPUT_DDTRACE_CUSTOMER_TAGS
Whitelist to tags
Type: JSON
input.conf:
customer_tagsExample:
'["sink_project", "custom_dd_tag"]' -
ENV_INPUT_DDTRACE_KEEP_RARE_RESOURCE
Keep rare tracing resources list switch
Type: Boolean
input.conf:
keep_rare_resourceDefault: false
-
ENV_INPUT_DDTRACE_COMPATIBLE_OTEL
Compatible
OTEL TracewithDDTrace traceType: Boolean
input.conf:
compatible_otelDefault: false
-
ENV_INPUT_DDTRACE_TRACE_ID_64_BIT_HEX
Compatible
B3/B3Multi TraceIDwithDDTraceType: Boolean
input.conf:
trace_id_64_bit_hexDefault: false
-
ENV_INPUT_DDTRACE_TRACE_128_BIT_ID
Trace IDs as 32 lowercase hexadecimal
Type: Boolean
input.conf:
trace_128_bit_idDefault: true
-
ENV_INPUT_DDTRACE_DEL_MESSAGE
Delete trace message
Type: Boolean
input.conf:
del_messageDefault: false
-
ENV_INPUT_DDTRACE_TRACING_METRIC_ENABLE
These metrics capture request counts, error counts, and latency measures.
Type: Boolean
input.conf:
tracing_metric_enableDefault: false
-
ENV_INPUT_DDTRACE_APMTELEMETRY_ROUTE_ENABLE
Enable route
/telemetry/proxy/api/v2/apmtelemetryand collect JVM metadata.Type: Boolean
input.conf:
apmtelemetry_route_enableDefault: true
-
ENV_INPUT_DDTRACE_TRACING_METRIC_TAG_BLACKLIST
Blacklist of tags in the metric: "tracing_metrics"
Type: JSON
input.conf:
tracing_metric_tag_blacklistExample:
'["tag_a", "tag_b"]' -
ENV_INPUT_DDTRACE_TRACING_METRIC_TAG_WHITELIST
Whitelist of tags in the metric: "tracing_metrics"
Type: JSON
input.conf:
tracing_metric_tag_whitelistExample:
'["tag_c", "tag_d"]' -
ENV_INPUT_DDTRACE_TRACING_METRIC_QPS_ENABLE
Collect one-second QPS from spans containing http.method or http.status_code.
Type: Boolean
input.conf:
tracing_metric_qps_enableDefault: false
-
ENV_INPUT_DDTRACE_TRACING_METRIC_QPS_TAGS
Tags used to group tracing QPS.
Type: JSON
input.conf:
tracing_metric_qps_tagsExample:
'["service", "env", "http_method"]' -
ENV_INPUT_DDTRACE_TRACING_METRIC_QPS_MAX_SERIES
Maximum QPS tag combinations per reporting window.
Type: Int
input.conf:
tracing_metric_qps_max_seriesDefault: 1000
-
ENV_INPUT_DDTRACE_OMIT_ERR_STATUS
Whitelist to error status
Type: JSON
input.conf:
omit_err_statusExample:
'["404", "403", "400"]' -
ENV_INPUT_DDTRACE_CLOSE_RESOURCE
Ignore tracing resources that service (regular)
Type: JSON
input.conf:
close_resourceExample:
'{"service1":["resource1","other"],"service2":["resource2","other"]}' -
ENV_INPUT_DDTRACE_SAMPLER
Global sampling rate
Type: Float
input.conf:
samplerExample: 0.3
-
ENV_INPUT_DDTRACE_THREADS
Total number of threads and buffer
Type: JSON
input.conf:
threadsExample:
'{"buffer":1000, "threads":100}' -
ENV_INPUT_DDTRACE_STORAGE
Local cache file path and size (MB)
Type: JSON
input.conf:
storageExample:
'{"storage":"./ddtrace_storage", "capacity": 5120}' -
ENV_INPUT_DDTRACE_TAGS
Customize tags. If there is a tag with the same name in the configuration file, it will be overwritten
Type: JSON
input.conf:
tagsExample:
'{"k1":"v1", "k2":"v2", "k3":"v3"}' -
ENV_INPUT_DDTRACE_ENV_INPUT_DDTRACE_MAX_SPANS
Max spans of single trace. Set to -1 to remove this limit
Type: Int
input.conf:
env_input_ddtrace_max_spansExample: 1000
Default: 100000
-
ENV_INPUT_DDTRACE_ENV_INPUT_DDTRACE_MAX_BODY_MB
Max body(in MiB) of single trace POST. Set to -1 to remove this limit
Type: Int
input.conf:
env_input_ddtrace_max_body_mbExample: 32
Default: 10
-
ENV_INPUT_DDTRACE_SAMPLING_PRIORITY_DROP_EXCLUDES
Rejected sampling priorities that bypass the DDTrace early drop decision; supported values: -3, -1, 0
Type: JSON
input.conf:
sampling_priority_drop_excludesExample:
'[0]'Default: []
customer_tags promotes selected span meta and metrics entries to the top level. String meta values become tags, while numeric metrics values become fields; unmatched entries remain in message. A . in a literal field name becomes _; for example, http.route becomes http_route. A regular expression must begin with reg: and uses Go regular-expression syntax; for example, reg:^key_.*$ matches fields beginning with key_. Validate expressions in a test environment first: an invalid expression prevents the collector from initializing correctly.
sampling_priority_drop_excludes lists rejected upstream sampling priorities that bypass DDTrace's early drop decision. Supported values are -3, -1, and 0. The default empty list preserves the existing behavior of dropping all three values. For example, with [0], a priority=0 trace continues through DataKit's normal filters and sampler; it is not force-kept. This setting cannot restore spans that the upstream did not send and may significantly increase the volume sent downstream.
The DataKit self-monitoring metrics datakit_input_ddtrace_sampling_priority_trace_total and datakit_input_ddtrace_sampling_priority_span_total record these decisions with priority, action (drop or bypass), and service labels. They prove how much data DataKit received and then dropped or bypassed, but cannot prove that a priority=0 value originated from W3C traceparent.
HTTP QPS
Enable the following options in the existing [[inputs.ddtrace]] configuration to report the qps field in the tracing_metrics measurement with source=ddtrace. This feature is disabled by default and is independent of tracing_metric_enable:
tracing_metric_qps_enable = true
tracing_metric_qps_tags = ["service", "env", "version", "span_kind", "http_method", "http_status_code"]
tracing_metric_qps_max_series = 1000
- Counts HTTP spans received by DataKit when either
http.methodorhttp.status_codeis nonempty, including the corresponding underscore field names. Both client and server spans count, without an entry-span restriction, so this is not a count of unique business requests. - Counts before DataKit truncates traces, samples them, or drops them based on
sampling_priority. Spans that the application never sends cannot be counted. - Groups spans by second and reports in batches every 60 seconds. Each point's
qpsis the span count for that second; empty seconds do not produce zero-valued points. Buckets normally use receive time, or consumption time when local storage is enabled, rather than span start time. SDK batching or storage backlogs can concentrate counts in particular seconds. tracing_metric_qps_tagscontrols grouping. Oncetracing_metric_qps_max_seriesis reached, new tag combinations are merged into a series withqps_overflow=true. Avoid high-cardinality tags such as URLs and user IDs.
Notes on Multi-Tool Trace Propagation
A traditional DDTrace Trace ID is a 64-bit integer, whereas W3C tracecontext uses a 128-bit, 32-character hexadecimal Trace ID. DDTrace places the upper 64 bits in _dd.p.tid; DataKit uses that field to reconstruct the full 128-bit ID.
Use a consistent propagation protocol across the call path and configure DataKit for the protocol actually emitted:
- When linking
tracecontexttraffic with OpenTelemetry, enablecompatible_otel=trueso span and parent IDs are formatted in hexadecimal.trace_128_bit_idis enabled by default and combines_dd.p.tidwith the lower 64-bit Trace ID. - When using
b3multiand the upstream sends a 64-bit hexadecimal Trace ID, enabletrace_id_64_bit_hex=true. - After changing propagation, validate one cross-service request. A protocol mismatch normally produces disconnected service topology rather than an ingestion failure.
For more combinations, see Multi-Tracing Propagation.
Info
compatible_otel: Formatsspan_idandparent_idas hexadecimal strings.trace_128_bit_id: Combines_dd.p.tidinmetaand the lower 64-bittrace_idinto a 32-character hexadecimal string. Default:true.trace_id_64_bit_hex: Parses an upstream 64-bittrace_idas hexadecimal.
Inject Pod and Node Information
When an application runs in Kubernetes, use the Downward API to put Pod, Namespace, and Node values in DD_TAGS. They travel with application spans. Add the fields to DataKit customer_tags as well if you need them as top-level tags in the trace list.
---
apiVersion: apps/v1
kind: Deployment
metadata:
  name: my-app
spec:
  selector:
    matchLabels:
      app: my-app
  replicas: 3
  template:
    metadata:
      labels:
        app: my-app
        service: my-service
    spec:
      containers:
        - name: my-app
          image: my-app:v0.0.1
          env:
            - name: POD_NAME
              valueFrom:
                fieldRef:
                  fieldPath: metadata.name
            - name: NODE_NAME
              valueFrom:
                fieldRef:
                  fieldPath: spec.nodeName
            - name: POD_NAMESPACE
              valueFrom:
                fieldRef:
                  fieldPath: metadata.namespace
            - name: DD_TAGS
              value: pod_name:$(POD_NAME),pod_namespace:$(POD_NAMESPACE),host:$(NODE_NAME)
            - name: DD_SERVICE
              valueFrom:
                fieldRef:
                  fieldPath: metadata.labels['service']
Kubernetes environment substitution can reference only environment variables defined earlier in the same container. Define POD_NAME, POD_NAMESPACE, and NODE_NAME before DD_TAGS.
After the application starts, enter the corresponding Pod and verify if the ENV is in effect:
Once injected successfully, you can see the Pod and Node names where the Span is located in the final Span data.
Warning
- Do not modify the
endpointslist here (unless you clearly understand the configuration logic and effects).
[inputs.ddtrace.sampler]is receiver-side sampling, independent of SDK-sideDD_TRACE_SAMPLE_RATE. To stop sampling at the receiver, remove or comment out the whole table. If the table remains, always set its rate explicitly:
sampling_rate = 1.0 keeps all traces. Do not comment out only sampling_rate while keeping the table header: the table is then interpreted as a zero rate and drops every trace. Error traces bypass receiver-side sampling by default; they can be filtered only when matching statuses are configured in omit_err_status.
HTTP Settings
DataKit listens on localhost:9529 by default. If traces arrive from a remote host or another Pod, set a reachable listener in datakit.conf, for example:
Use this only on a controlled network. Do not expose trace endpoints directly to the Internet; apply firewall rules, security groups, Kubernetes Services/NetworkPolicies, or TLS as appropriate. DataKit receives /v0.3/traces, /v0.4/traces, and /v0.5/traces by default. Do not change endpoints unless you understand the compatibility impact.
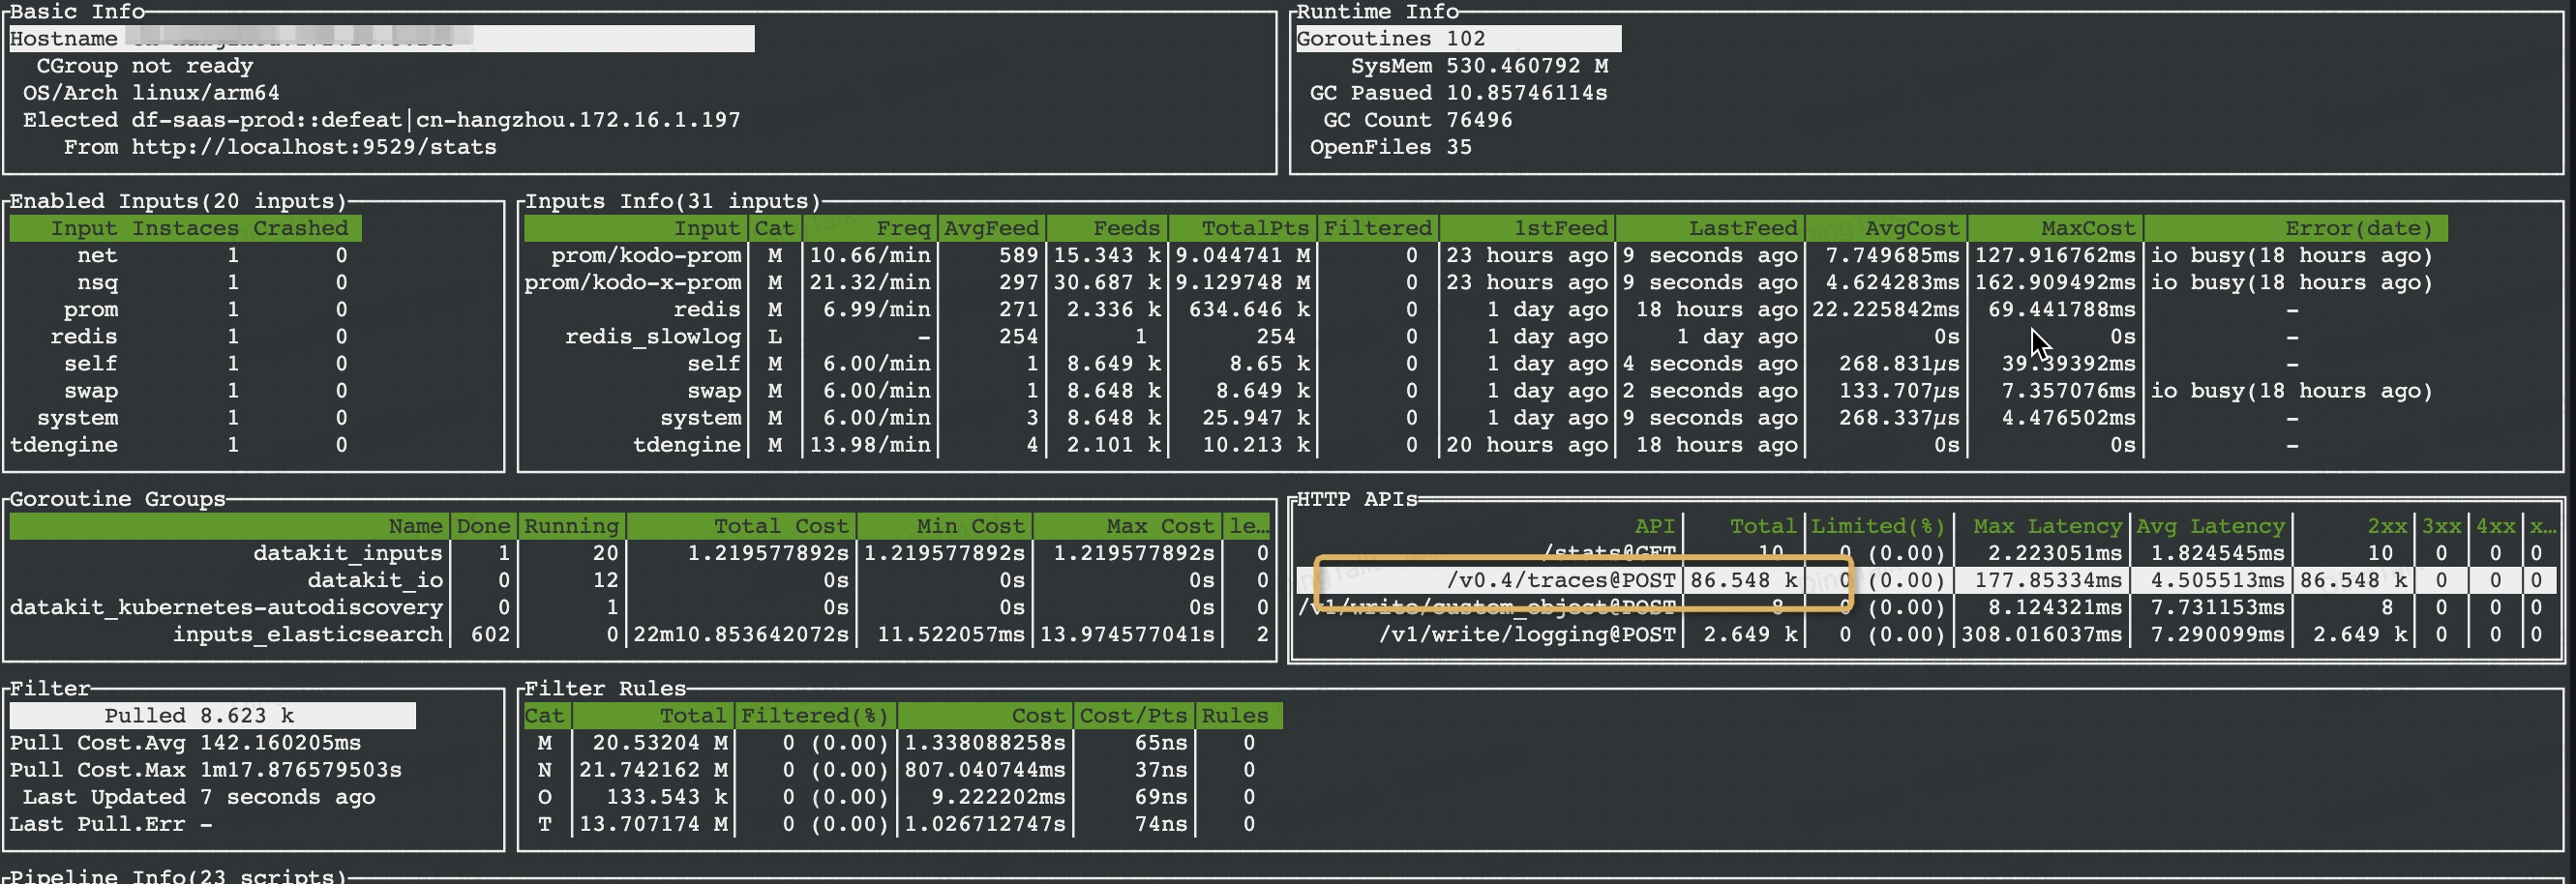
If DDTrace data is sent to DataKit, you can view it on the DataKit monitor:
Enable Disk Cache
Disk cache defers processing of HTTP request bodies during traffic spikes, reducing memory and processing peaks. It is not long-term archival and does not replace SDK-side sampling. The directory must be writable, have enough capacity, and be on persistent storage when recovery after a container restart matters. capacity is in MiB.
DDTrace SDK Configuration
After configuring the collector, configure the SDK. Supported variables and precedence vary by language and SDK version. The variables below describe common concepts. When an SDK supports DD_TRACE_AGENT_URL, that URL normally overrides separate host and port values, so do not set conflicting destinations.
Environment Variable Settings
| Variable | Purpose | Recommendation |
|---|---|---|
DD_AGENT_HOST, DD_TRACE_AGENT_PORT |
Trace receiver address and port | Point them at DataKit, such as datakit-service:9529; do not use the StatsD port 8125. |
DD_SERVICE, DD_ENV, DD_VERSION |
Service, environment, and version identity | Use stable, searchable values for every service. |
DD_TAGS |
Application-wide tags | Use key:value pairs. Never put tokens, request bodies, or personal data here. |
DD_TRACE_SAMPLE_RATE |
SDK-side sampling rate | Use a value from 0.0 to 1.0; control high traffic at the source first. |
DD_TRACE_ENABLED |
Enables instrumentation/trace delivery | Exact behavior is language-dependent; during troubleshooting verify it is not false. |
DD_TRACE_STARTUP_LOGS, DD_TRACE_DEBUG |
SDK startup and debug logs | Enable only temporarily for troubleshooting to avoid extra volume or configuration exposure. |
In addition to setting the project name, environment name, and version number during application initialization, you can also set them in the following two ways:
- Inject environment variables via the command line
- Configure receiver-side tags directly in ddtrace.conf. They affect every DDTrace payload entering this DataKit and are suitable for shared deployment tags, not application-specific service identity:
# tags are key-value pairs configured for ddtrace
[inputs.ddtrace.tags]
  some_tag = "some_value"
  more_tag = "some_other_value"
APMTelemetry
The Java Agent can report startup configuration, heartbeat, dependencies, and loaded integrations through /telemetry/proxy/api/v2/apmtelemetry. DataKit accepts this route by default; disable apmtelemetry_route_enable if it is not needed. View the data in the TrueWatch Infrastructure Resource Directory to troubleshoot startup options, dependency versions, and loaded instrumentation.
Data may vary significantly across different languages and versions; please refer to the actual received data.
Fixed Tag Extraction
Starting with DataKit 1.21.0, DataKit no longer promotes every Span.Meta field to a top-level tag. It extracts only the commonly used fields below to control tag cardinality and indexing cost.
The following is a list of tags that may be extracted:
| Original Meta Field | Extracted Field Name | Description |
|---|---|---|
http.url |
http_url |
Full HTTP request path |
http.hostname |
http_hostname |
Hostname |
http.route |
http_route |
Route |
http.status_code |
http_status_code |
Status code |
http.method |
http_method |
Request method |
http.client_ip |
http_client_ip |
Client IP |
sampling.priority |
sampling_priority |
Sampling status |
span.kind |
span_kind |
Span type |
error |
error |
Whether an error occurred |
runtime.name |
runtime_name |
Runtime name |
dd.version |
dd_version |
Agent version |
error.message |
error_message |
Error message |
error.stack |
error_stack |
Stack trace information |
error.type |
error_type |
Error type |
system.pid |
pid |
Process ID (pid) |
error.msg |
error_message |
Error message |
project |
project |
Project name |
version |
version |
Version |
env |
env |
Environment |
host |
host |
Hostname in tags |
pod_name |
pod_name |
Pod name in tags |
pod_namespace |
pod_namespace |
pod namespace |
_dd.base_service |
_dd_base_service |
Parent service |
peer.hostname |
db_host |
May be an IP or domain name (depends on configuration) |
db.type |
db_system |
Database type: mysql, oracle, etc. |
db.instance |
db_name |
Database name |
out.host |
out_host |
Database or Middleware host |
dd_ext_version |
sdk_version |
SDK extend version |
language |
sdk_language |
SDK language |
Fields outside the list remain in the span meta and are available in trace details. Whether they can be used as top-level filters depends on the UI and indexing configuration.
Starting with DataKit 1.22.0, add fields to the customer_tags allowlist when they must become top-level tags. A . becomes _ during extraction. Add only stable, low-cardinality fields; never promote values such as user IDs or request IDs.
Common Troubleshooting Paths
| Symptom | Check first |
|---|---|
| No traces at all | Confirm that ddtrace is enabled in DataKit, that the application actually loaded its SDK/Agent, and that DD_AGENT_HOST, DD_TRACE_AGENT_PORT, Service, NetworkPolicy, and firewall settings are correct. |
| Only some services appear or topology is broken | Ensure propagation protocols match on both sides and that the appropriate tracecontext/B3 DataKit ID compatibility switches are enabled. |
| JVM metrics or profiling are missing | They are not received by this collector. Check the statsd or profile collector and its separate port. |
| Data volume or resource use is too high | Reduce SDK-side sampling first, then evaluate receiver-side sampling, trace_max_spans, max_trace_body_mb, and disk cache. |
Collected Data Field Description
Tracing
ddtrace
Following is tags/fields of tracing data
| Tags & Fields | Description |
|---|---|
| base_service ( tag) |
Span base service name |
| container_host ( tag) |
Container hostname. Available in OpenTelemetry. Optional. |
| db_host ( tag) |
DB host name: ip or domain name. Optional. |
| db_name ( tag) |
Database name. Optional. |
| db_system ( tag) |
Database system name:mysql,oracle... Optional. |
| dk_fingerprint ( tag) |
DataKit fingerprint(always DataKit's hostname) |
| endpoint ( tag) |
Endpoint info. Available in SkyWalking, Zipkin. Optional. |
| env ( tag) |
Application environment info. Available in Jaeger. Optional. |
| host ( tag) |
Hostname. |
| http_method ( tag) |
HTTP request method name. Available in DDTrace, OpenTelemetry. Optional. |
| http_route ( tag) |
HTTP route. Optional. |
| http_status_code ( tag) |
HTTP response code. Available in DDTrace, OpenTelemetry. Optional. |
| http_url ( tag) |
HTTP URL. Optional. |
| operation ( tag) |
Span name |
| out_host ( tag) |
This is the database host, equivalent to db_host,only DDTrace-go. Optional. |
| project ( tag) |
Project name. Available in Jaeger. Optional. |
| service ( tag) |
Service name. Optional. |
| source_type ( tag) |
Tracing source type |
| span_type ( tag) |
Span type |
| status ( tag) |
Span status |
| version ( tag) |
Application version info. Available in Jaeger. Optional. |
| duration | Duration of span Type: int | (gauge) Unit: time,μs |
| message | Origin content of span Type: string Unit: N/A |
| parent_id | Parent span ID of current span Type: string Unit: N/A |
| resource | Resource name produce current span Type: string Unit: N/A |
| span_id | Span id Type: string Unit: N/A |
| start | start time of span. Type: int | (gauge) Unit: timeStamp,usec |
| trace_id | Trace id Type: string Unit: N/A |
Metrics
tracing_metrics
Based on DDTrace's span data, we count span count, span cost metrics
| Tags & Fields | Description |
|---|---|
| collector_source_ip ( tag) |
Remote agent IP. |
| env ( tag) |
Application environment info(if set in span). |
| host ( tag) |
Hostname. |
| http_direction ( tag) |
HTTP span direction derived from span_kind: inbound/outbound/unknown. |
| http_method ( tag) |
HTTP request method |
| http_status_class ( tag) |
HTTP response code class, such as 2xx/3xx/4xx/5xx |
| http_status_code ( tag) |
HTTP response code |
| operation ( tag) |
Span name |
| pod_name ( tag) |
Pod name(if set in span). |
| pod_namespace ( tag) |
Pod namespace(if set in span). |
| project ( tag) |
Project name(if set in span). |
| qps_overflow ( tag) |
Whether tag combinations exceeded the configured QPS series limit. |
| resource ( tag) |
Application resource name. |
| service ( tag) |
Service name. |
| source ( tag) |
Source, always ddtrace |
| span_kind ( tag) |
Span role, such as server/client/internal |
| status ( tag) |
Span status(ok/error) |
| version ( tag) |
Application version info. |
| apdex | Measures the Apdex score for each web service. The currently set satisfaction threshold is 2 seconds.The tags for this metric are fixed: service/env/version/resource/source. The value range is 0~1.Type: float | (gauge) Unit: N/A |
| errors | Represent the count of errors for spans. Type: int | (gauge) Unit: count |
| errors_by_http_status | Represent the count of errors for a given span group by HTTP status code. Type: int | (gauge) Unit: count |
| hits | Count of spans. Type: int | (count) Unit: count |
| hits_by_http_status | Represent the count of hits for a given span group by HTTP status code. Type: int | (gauge) Unit: count |
| latency_bucket | Represent the latency distribution for all services, resources, and versions across different environments and additional primary tags. Recommended for all latency measurement use cases. Use the 'le' tag for filtering Type: int | (histogram) Unit: count |
| latency_count | The number of spans is equal to the number of web type spans. Type: int | (count) Unit: count |
| latency_sum | The total latency of all web spans, corresponding to the 'latency_count' Type: int | (gauge) Unit: time,μs |
| qps | Number of HTTP spans observed in a one-second bucket. An HTTP span contains http.method or http.status_code. Type: int | (gauge) Unit: throughput,reqps |
Custom Objects
The extended Java Agent can report its configuration, integration list, dependencies, and service metadata after startup. These resource objects currently apply only to the Java Agent. Common events include:
app_client_configuration_change: Contains the agent's configuration informationapp_dependencies_loaded: Dependency list (including package names and version information)app_integrations_change: Integration list (including package names and whether the agent is enabled)- Other host information, service information, etc.
tracing_service
Collect service, host, process APM telemetry message.
| Tags & Fields | Description |
|---|---|
| architecture ( tag) |
Architecture |
| env ( tag) |
Service ENV |
| hostname ( tag) |
Host name |
| kernel_name ( tag) |
Kernel name |
| kernel_release ( tag) |
Kernel release |
| kernel_version ( tag) |
Kernel version |
| language_name ( tag) |
Language name |
| language_version ( tag) |
Language version |
| name ( tag) |
Same as service name |
| os ( tag) |
OS name |
| os_version ( tag) |
OS version |
| runtime_id ( tag) |
Runtime ID |
| runtime_name ( tag) |
Runtime name |
| runtime_patches ( tag) |
Runtime patches |
| runtime_version ( tag) |
Runtime version |
| service ( tag) |
Service |
| service_version ( tag) |
Service version |
| tracer_version ( tag) |
DDTrace version |
| app_client_configuration_change | JSON payload from a DDTrace APM telemetry client-configuration-change request. Type: string | (string) Unit: N/A |
| app_closing | JSON payload from a DDTrace APM telemetry app-closing request. Type: string | (string) Unit: N/A |
| app_dependencies_loaded | JSON payload containing dependencies loaded by the traced application. Type: string | (string) Unit: N/A |
| app_integrations_change | JSON payload from a DDTrace APM telemetry integrations-change request. Type: string | (string) Unit: N/A |
| app_started | JSON payload from the DDTrace APM telemetry app-started request. Type: string | (string) Unit: N/A |
| spans_created | Number of spans created by the traced application as reported by DDTrace telemetry. Type: float | (count) Unit: count |
| spans_finished | Number of spans finished by the traced application as reported by DDTrace telemetry. Type: float | (count) Unit: count |