DDTrace C++
This page describes a compatibility setup for dd-opentracing-cpp. The SDK requires business code to create and finish spans manually. Because common C++ middleware has no reusable auto-instrumentation here, first instrument only stable request entry points and important external calls.
Warning
Upstream has deprecated dd-opentracing-cpp and recommends dd-trace-cpp. This page remains for already-integrated applications. New projects should evaluate the newer SDK and validate protocol and feature compatibility with DataKit; do not treat this legacy example as a long-term technology recommendation.
Install Library and Dependencies
- Download the DDTrace-C++ SDK
- Compile and install the SDK
# Install dependencies
cd dd-opentracing-cpp && sudo scripts/install_dependencies.sh

# Compile and install
mkdir .build && cd .build && cmake .. && make && make install
After building, run the SDK's own tests in a test environment before connecting an application to DataKit. To isolate a build issue, you can temporarily use the header files and dynamic libraries prepared by TrueWatch; production should still use traceable artifacts compatible with the runtime.
The upstream repository provides early Windows build guidance, but this page does not provide a DataKit-validated Windows combination. Build and validate the target compiler, runtime libraries, and DataKit network path before using it in production.
Build Tools
Use a distribution-supported CMake, C++14 compiler, and build toolchain. Read the current upstream dependency guide before installation; do not replace system-wide compiler or CMake packages on a production host just for this example.
C++ Code Example
The following minimal example shows manual instrumentation. The important parts are setting service identity and the DataKit destination when creating the tracer, calling Finish() for every span, and calling Close() before the process exits to flush buffered data.
#include <datadog/opentracing.h>

#include <chrono>
#include <thread>

int main() {
    datadog::opentracing::TracerOptions options;
    options.service = "cpp-demo";
    options.environment = "test";
    options.agent_host = "127.0.0.1";
    options.agent_port = 9529;

    auto tracer = datadog::opentracing::makeTracer(options);

    {
        auto span = tracer->StartSpan("read_file");
        span->SetTag("file.path", "example.txt");
        std::this_thread::sleep_for(std::chrono::milliseconds(20));
        span->Finish();
    }

    tracer->Close(); // Flush buffered spans before process exit.
    return 0;
}
Compile and Run
c++ -std=c++14 -Wall -Wextra demo.cc -o demo \
  -I/usr/local/include -L/usr/local/lib \
  -Wl,-rpath,/usr/local/lib -ldd_opentracing

DD_AGENT_HOST=localhost \
DD_TRACE_AGENT_PORT=9529 \
DD_SERVICE=cpp-demo \
./demo
The example assumes that make install places headers and the shared library in /usr/local/include and /usr/local/lib. Some distributions use lib64; adjust both -L and the rpath together. Environment variables override matching TracerOptions fields, so they are useful for switching the DataKit destination without recompiling.
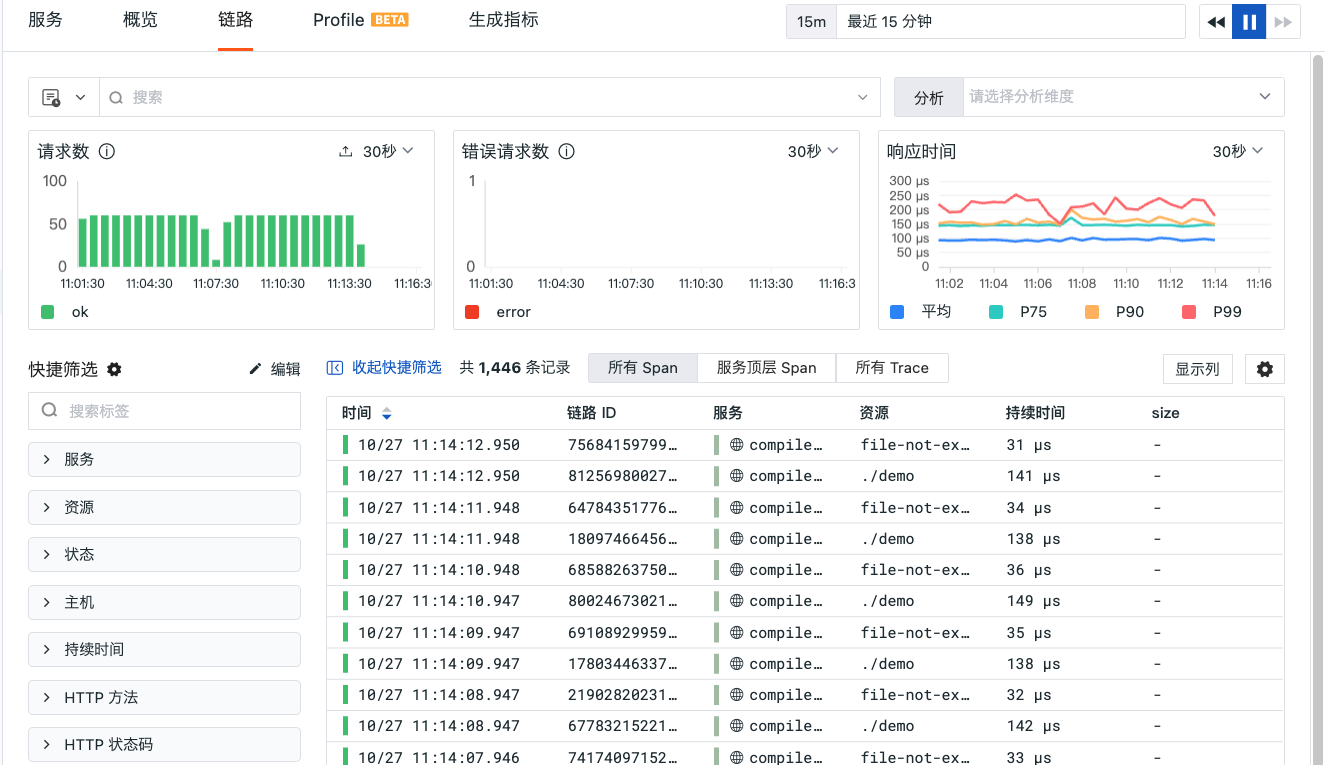
After running the program for a while, you can see trace data similar to the following in TrueWatch:
Environment Variable Support
Supported Environment Variables
The following environment variables are supported to specify some configuration parameters of DDTrace when starting the program, and their basic form is:
Common environment variables follow. DD_TRACE_AGENT_URL (for example, http://datakit:9529) takes precedence over DD_AGENT_HOST and DD_TRACE_AGENT_PORT. See DDTrace documentation for the full legacy-SDK configuration.
-
DD_VERSIONSets the application version, such as
1.2.3,2022.02.13 -
DD_AGENT_HOSTDefault:
localhostSets the DataKit address. The common upstream default is
localhost. -
DD_TRACE_AGENT_PORTSets the trace receiver port. The common upstream default is
8126; specify the DataKit HTTP port (normally9529) for DataKit. -
DD_ENVSets the current environment of the application, such as prod, pre-prod, etc.
-
DD_SERVICESets the application service name
-
DD_TRACE_SAMPLING_RULESUse a JSON array of rules, evaluated in order.
sample_rateranges from[0.0, 1.0].Example 1: Sample every trace at 20%:
DD_TRACE_SAMPLING_RULES='[{"sample_rate":0.2}]' ./demoExample 2: Sample at 10% when service matches
app1.*and span name isabc, otherwise at 20%:DD_TRACE_SAMPLING_RULES='[{"service":"app1.*","name":"abc","sample_rate":0.1},{"sample_rate":0.2}]' ./demo -
DD_TAGSHere you can inject a set of global tags, which will appear in each span and profile data. Multiple tags can be separated by spaces and commas, such as
layer:api,team:intake,layer:api team:intake