Explorer
The Database display covers infrastructure database data supported by DataKit collection. Through a centralized explorer, you can monitor key metrics of databases such as MySQL, SQL Server, PostgreSQL, Oracl, MongoDB, including version, uptime, load trend, blocking rate, etc.
Note
The DataKit collector has been updated. Contact your administrator to upgrade the version to enable the new database monitoring experience.
Data Display
The Database Explorer provides multiple professional analysis views based on list and chart formats.
Displays the latest metrics data for the corresponding database in the current workspace, including database address, instance name, database type, version, uptime, QPS, load trend, blocking rate, etc.
Displays data in chart formats such as top list, pie chart, treemap, and grouped table, based on count, last, first, and count_distinct aggregation modes, filtered by the by condition.
Data List
The Database list page displays the core status of each instance in card-style rows. An icon corresponding to the database type is shown before the database address for quick identification of MySQL, PostgreSQL, Oracle, SQL Server, MongoDB, etc.
The list fields are described as follows:
| Field | Description |
|---|---|
| Database Address | The connection address of the database instance, displayed in full on the detail page without width restriction |
| Instance Name | The database instance identifier |
| Type | The database type, e.g., MySQL, PostgreSQL, etc. |
| Version | The database version number |
| Uptime | The time the instance has been running |
| QPS | Queries per second, including current value and trend thumbnail |
| Load Trend | Session load distribution trend aggregated by wait type |
| Blocking Rate | The current database blocking percentage |
Time Widget
In the upper-right corner of the explorer, you can select data for different time ranges.
Data Details
Clicking a single data item in the Database Explorer opens a side panel with the corresponding detail page. You can view scattered data such as the overview, queries, sessions, metrics, logs, and custom linked views for that item, avoiding repeated navigation.
Overview
The Overview page displays the core operational status of the database instance. The top of the page shows the instance name, version, uptime, slow query log status, and the host information, helping you quickly locate the infrastructure resources where the database instance resides.
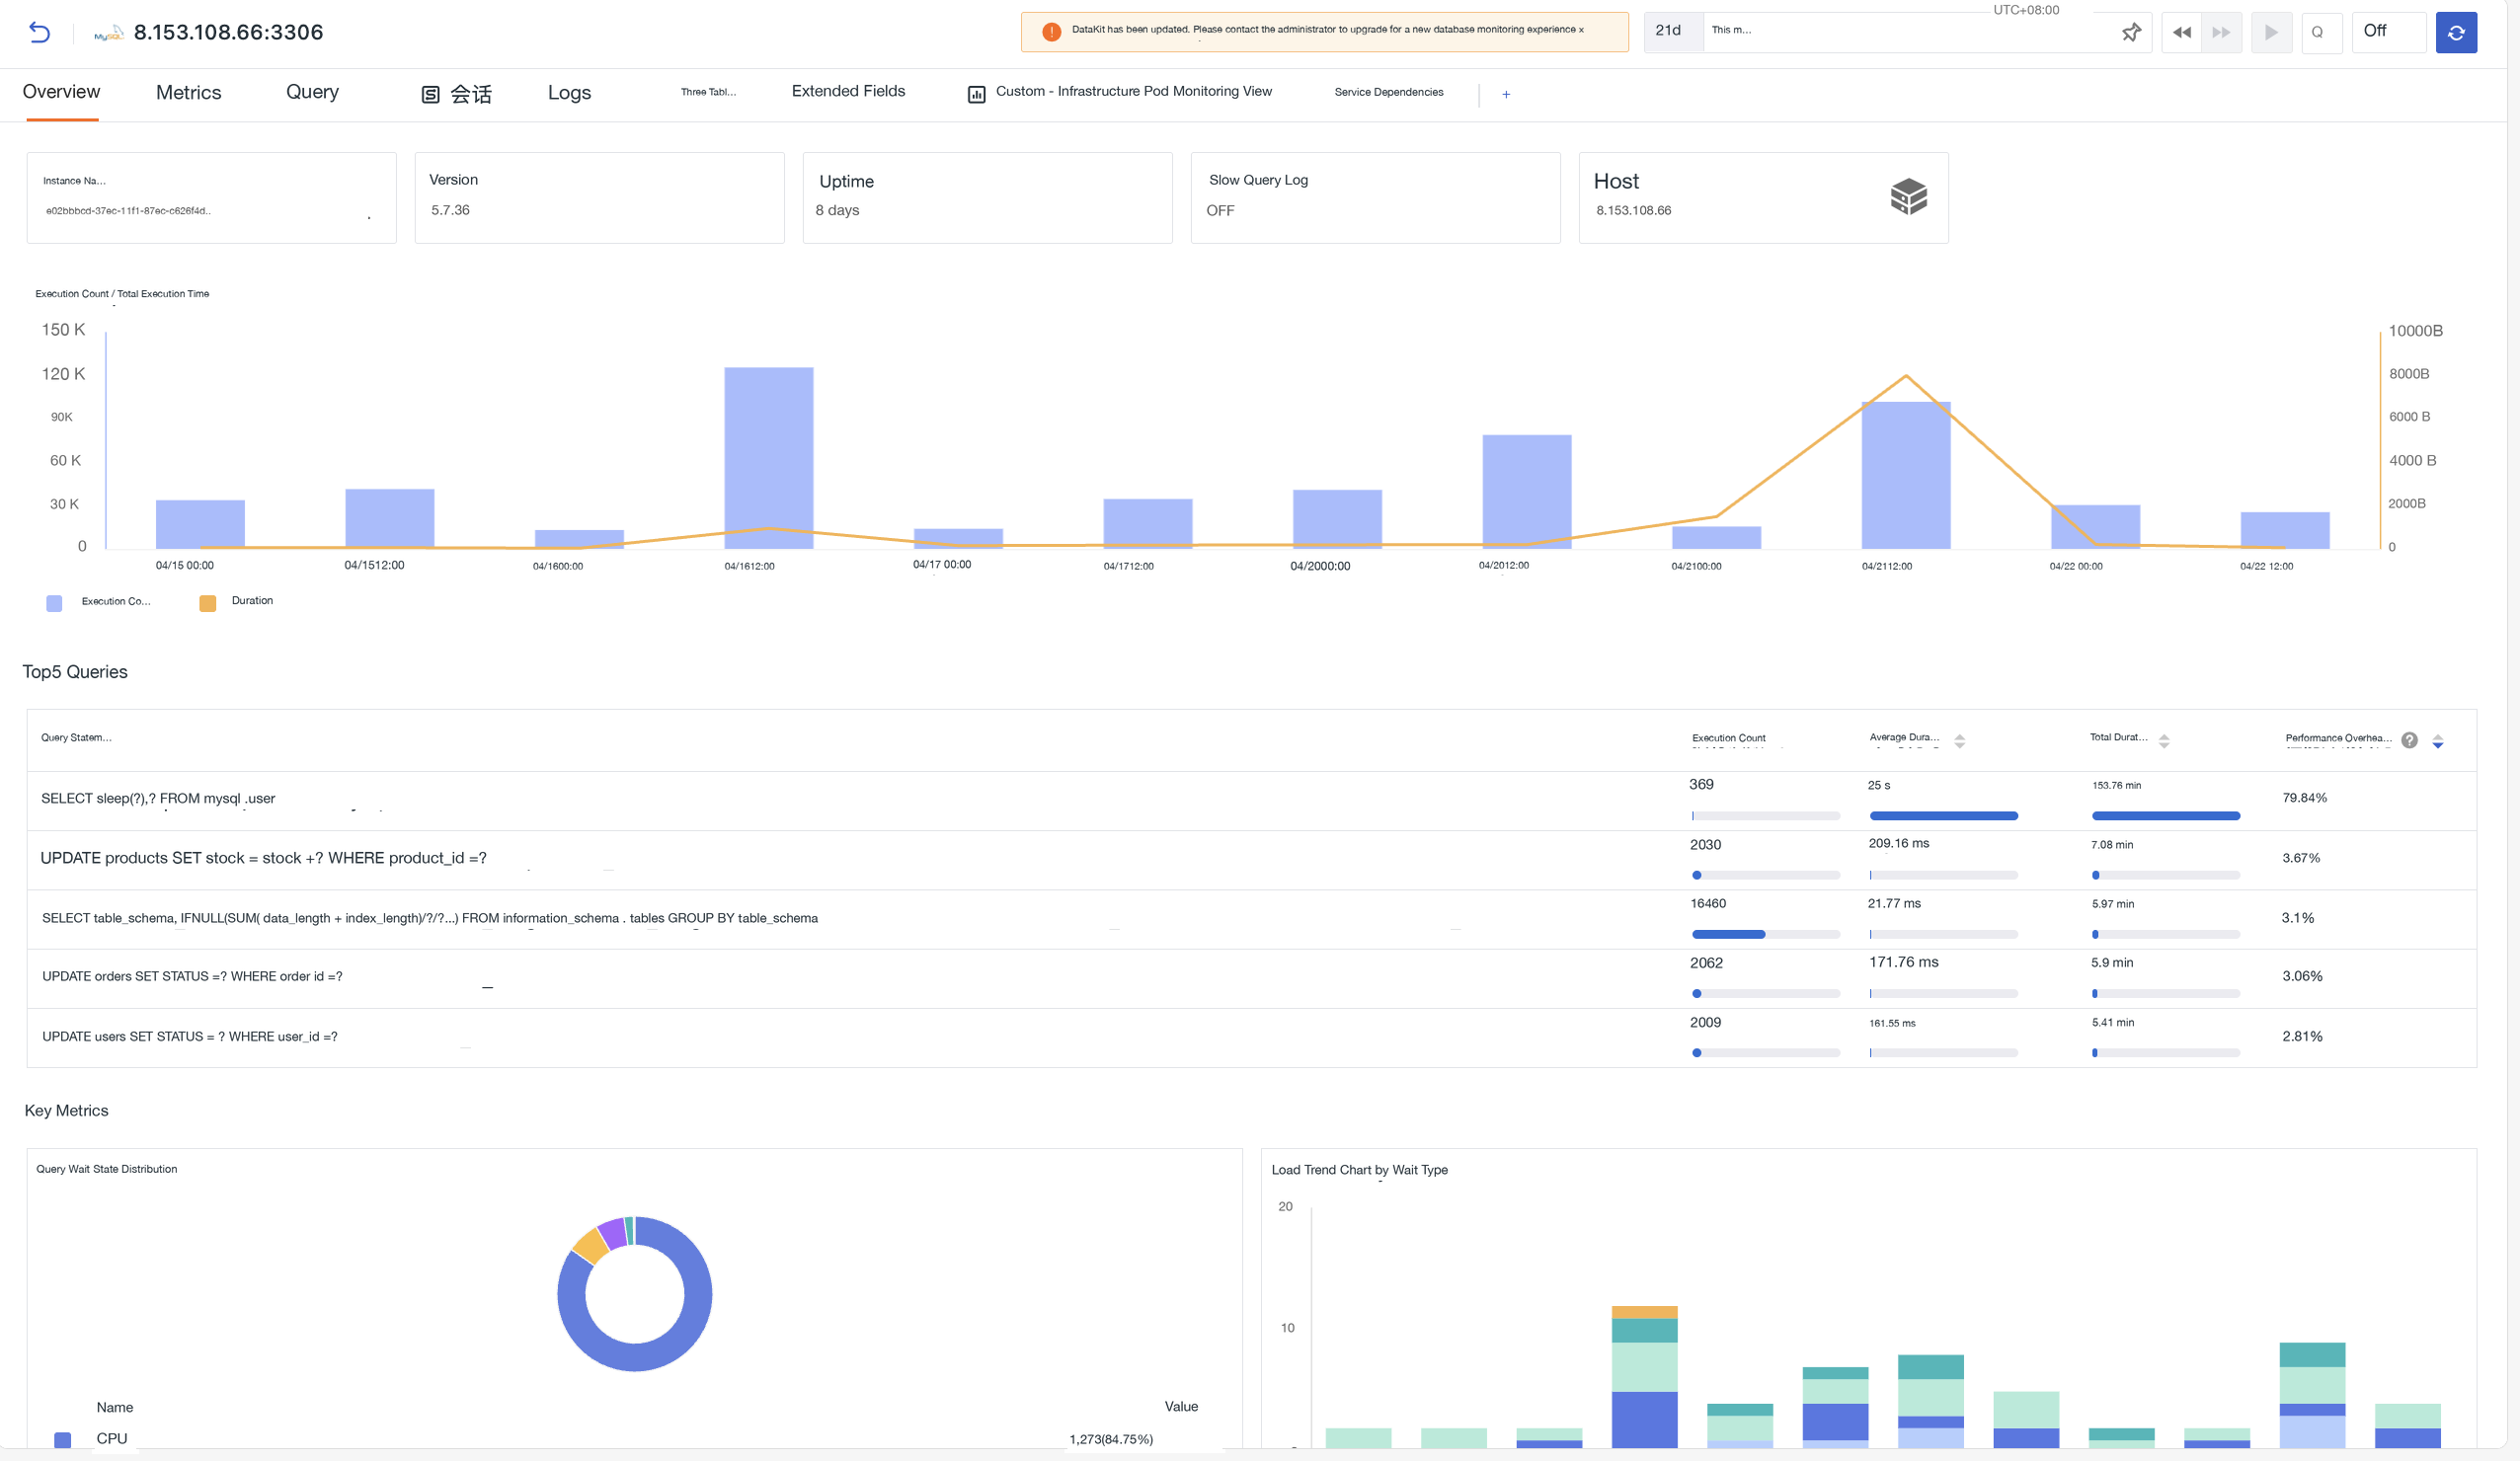
Execution Count / Total Execution Time
The left Y-axis shows the total execution count of all queries in the time interval as a bar chart, and the right Y-axis shows the total execution time of all queries in the time interval as a line chart.
Top 5 Queries
Displays the top queries sorted by total execution time, including the query statement, execution count, average execution time, total execution time, and performance overhead percentage. Click any query to enter the Query Overview for details.
- Sorted by total execution time in descending order by default;
- Click any row to open the Query Overview side panel.
Key Metrics
1. Query Wait Status Distribution
Displays the distribution of wait events for current database sessions as a donut chart, aggregated by wait status.
2. Load Trend by Wait Type/Database/User
A bar chart shows the database load distribution by wait type, database, or user, visually presenting the proportion changes of various load types such as Idle, CPU, Application, System I/O, etc.
3. Key Resource Metrics
Displays the key resource consumption trends of the node where the database resides, including:
- CPU: CPU usage, CPU load
- Disk: Disk read/write latency, bytes read/written per second, IOPS, disk usage
- Network: Network traffic/sec, network packets/sec
- Memory: Memory usage, memory amount
Metrics
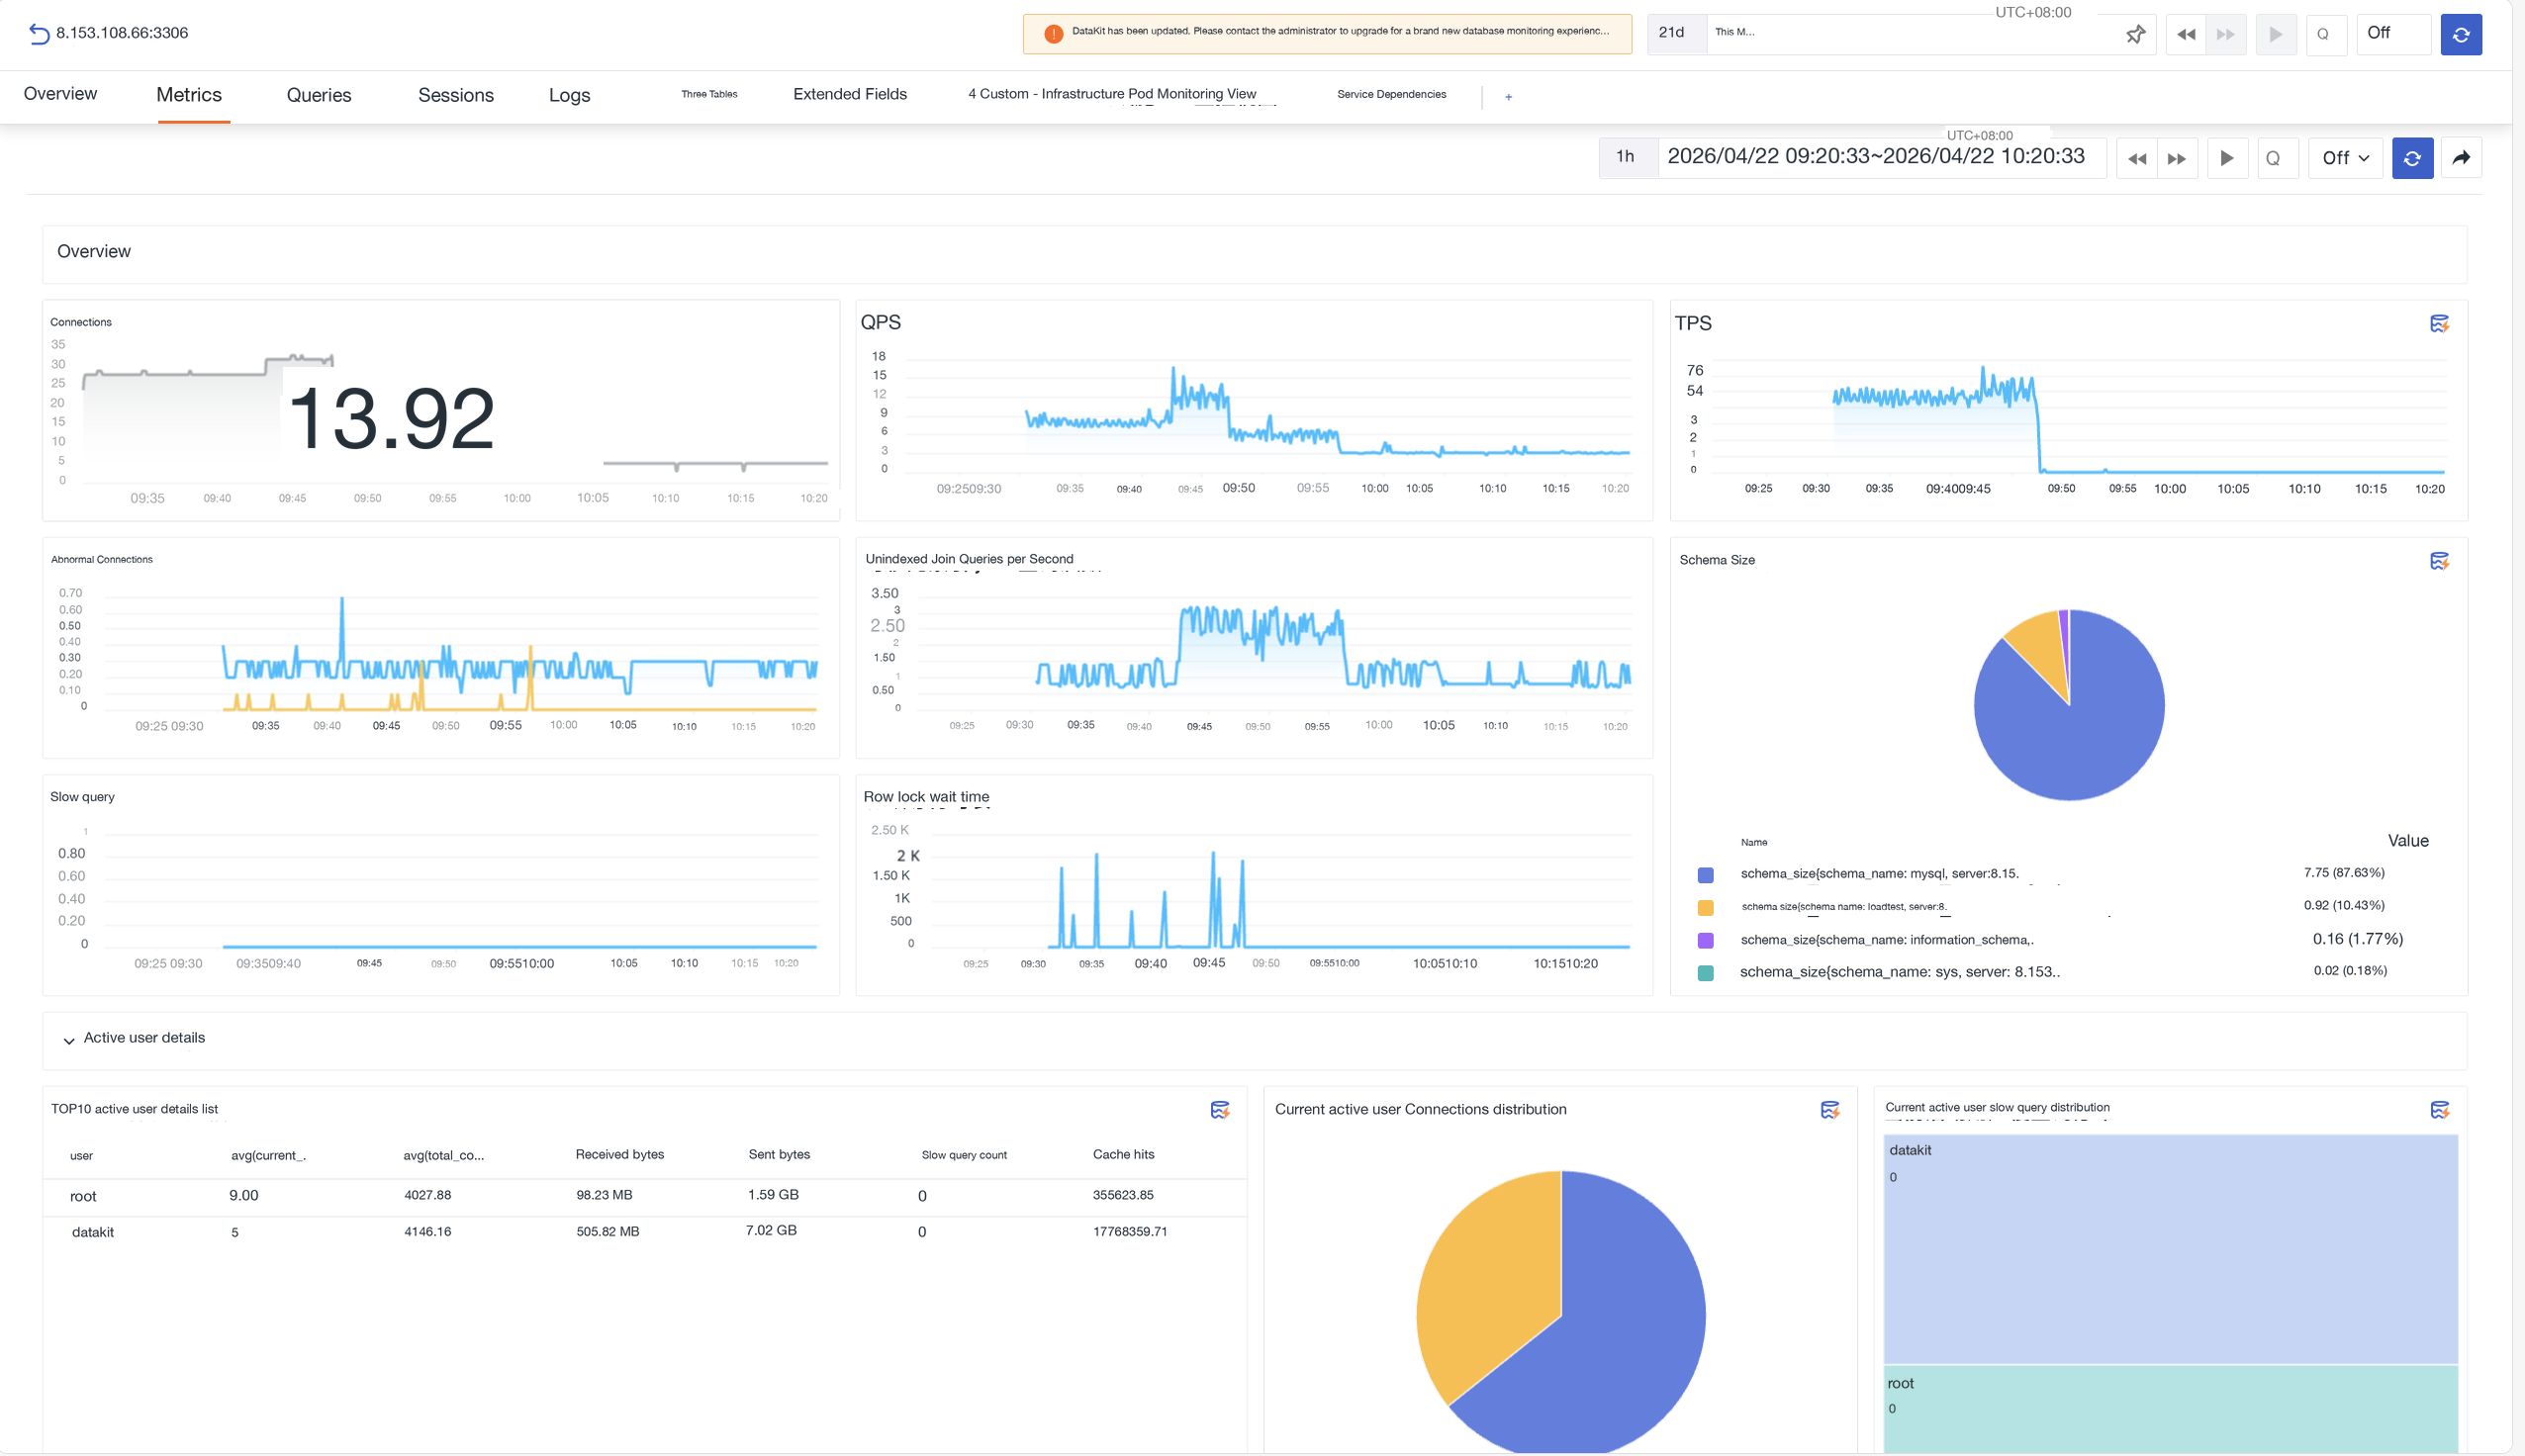
Displays comprehensive performance metrics of the database in visual chart form, including core metrics such as session count, response time, cache hit ratio, tablespace usage, PGA memory, etc.
Query
Focuses on SQL performance analysis to help locate slow queries and performance bottlenecks.
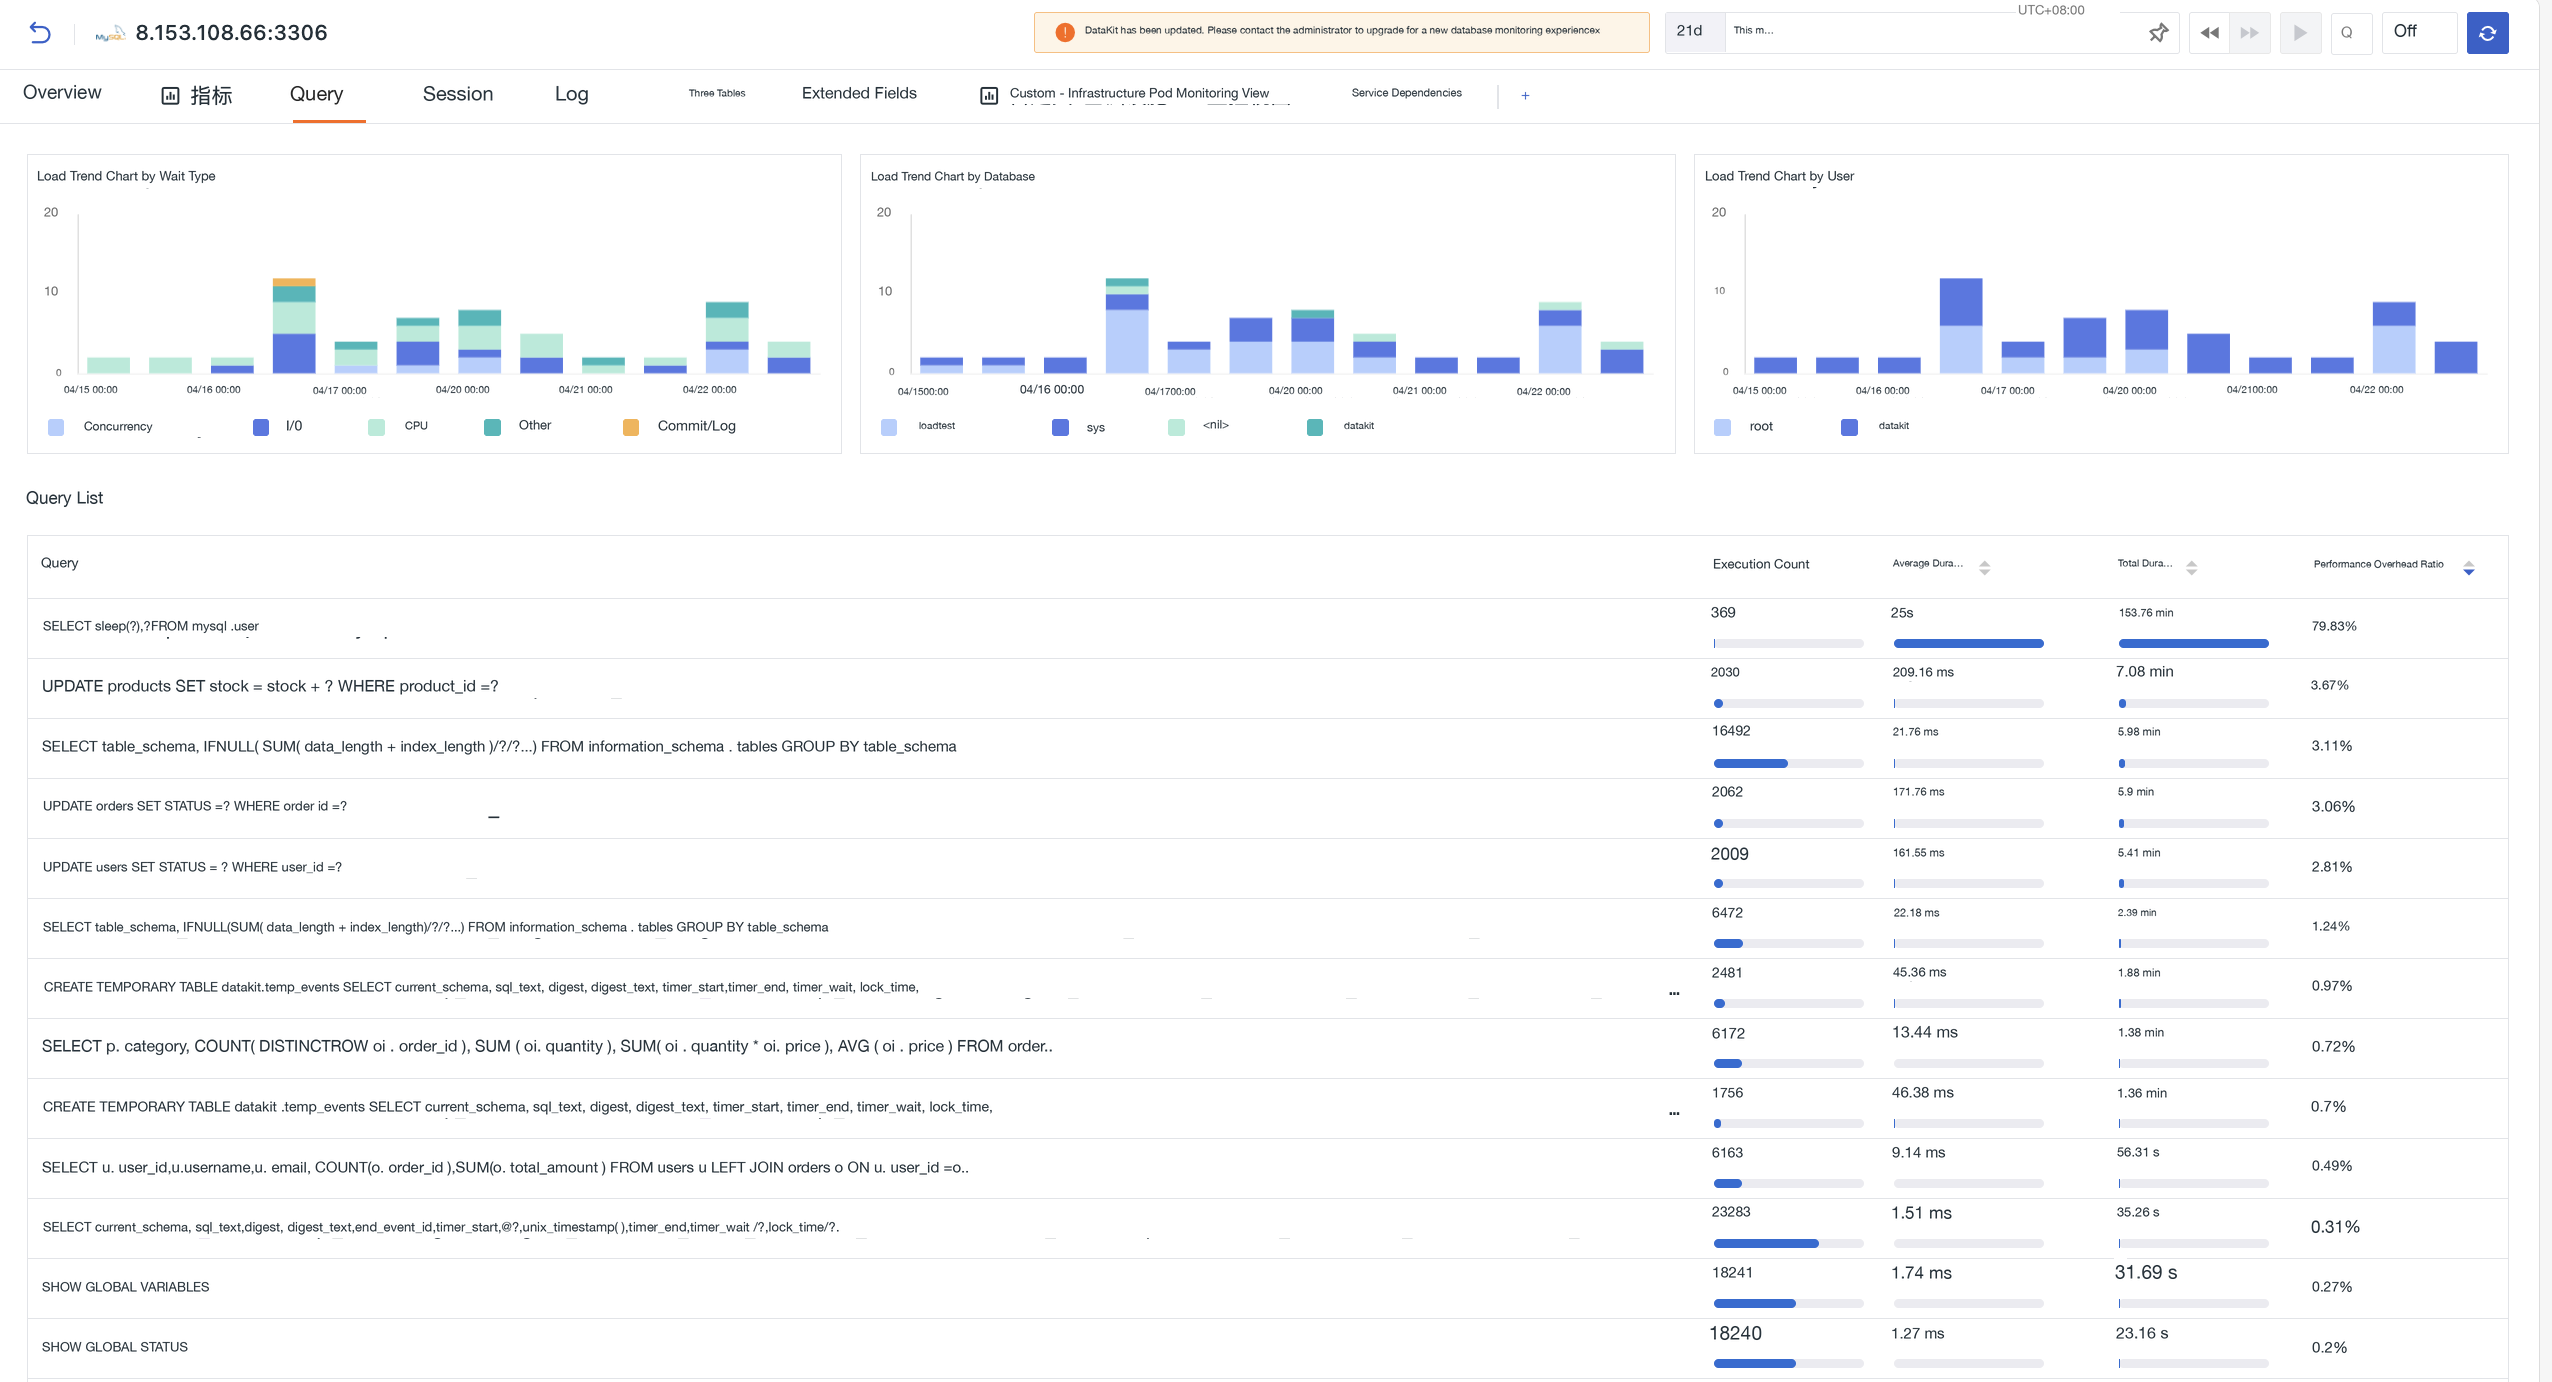
The top shows a load trend chart aggregated by wait type, database, and user. Below is a query list showing the execution count, average execution time, total execution time, and performance overhead percentage for each SQL statement, with sorting support by each dimension.
- Click any query to open the Query Overview side panel, where you can view the SQL statement, performance trend chart, and sampled records;
- Click a sampled record to drill down into query details and view the complete log data for that sample;
- In the upper-right corner of the SQL statement area, click AI Optimization Suggestions to open the TOBY AI TruePilot side panel, which automatically performs optimization analysis for that query.

Sessions
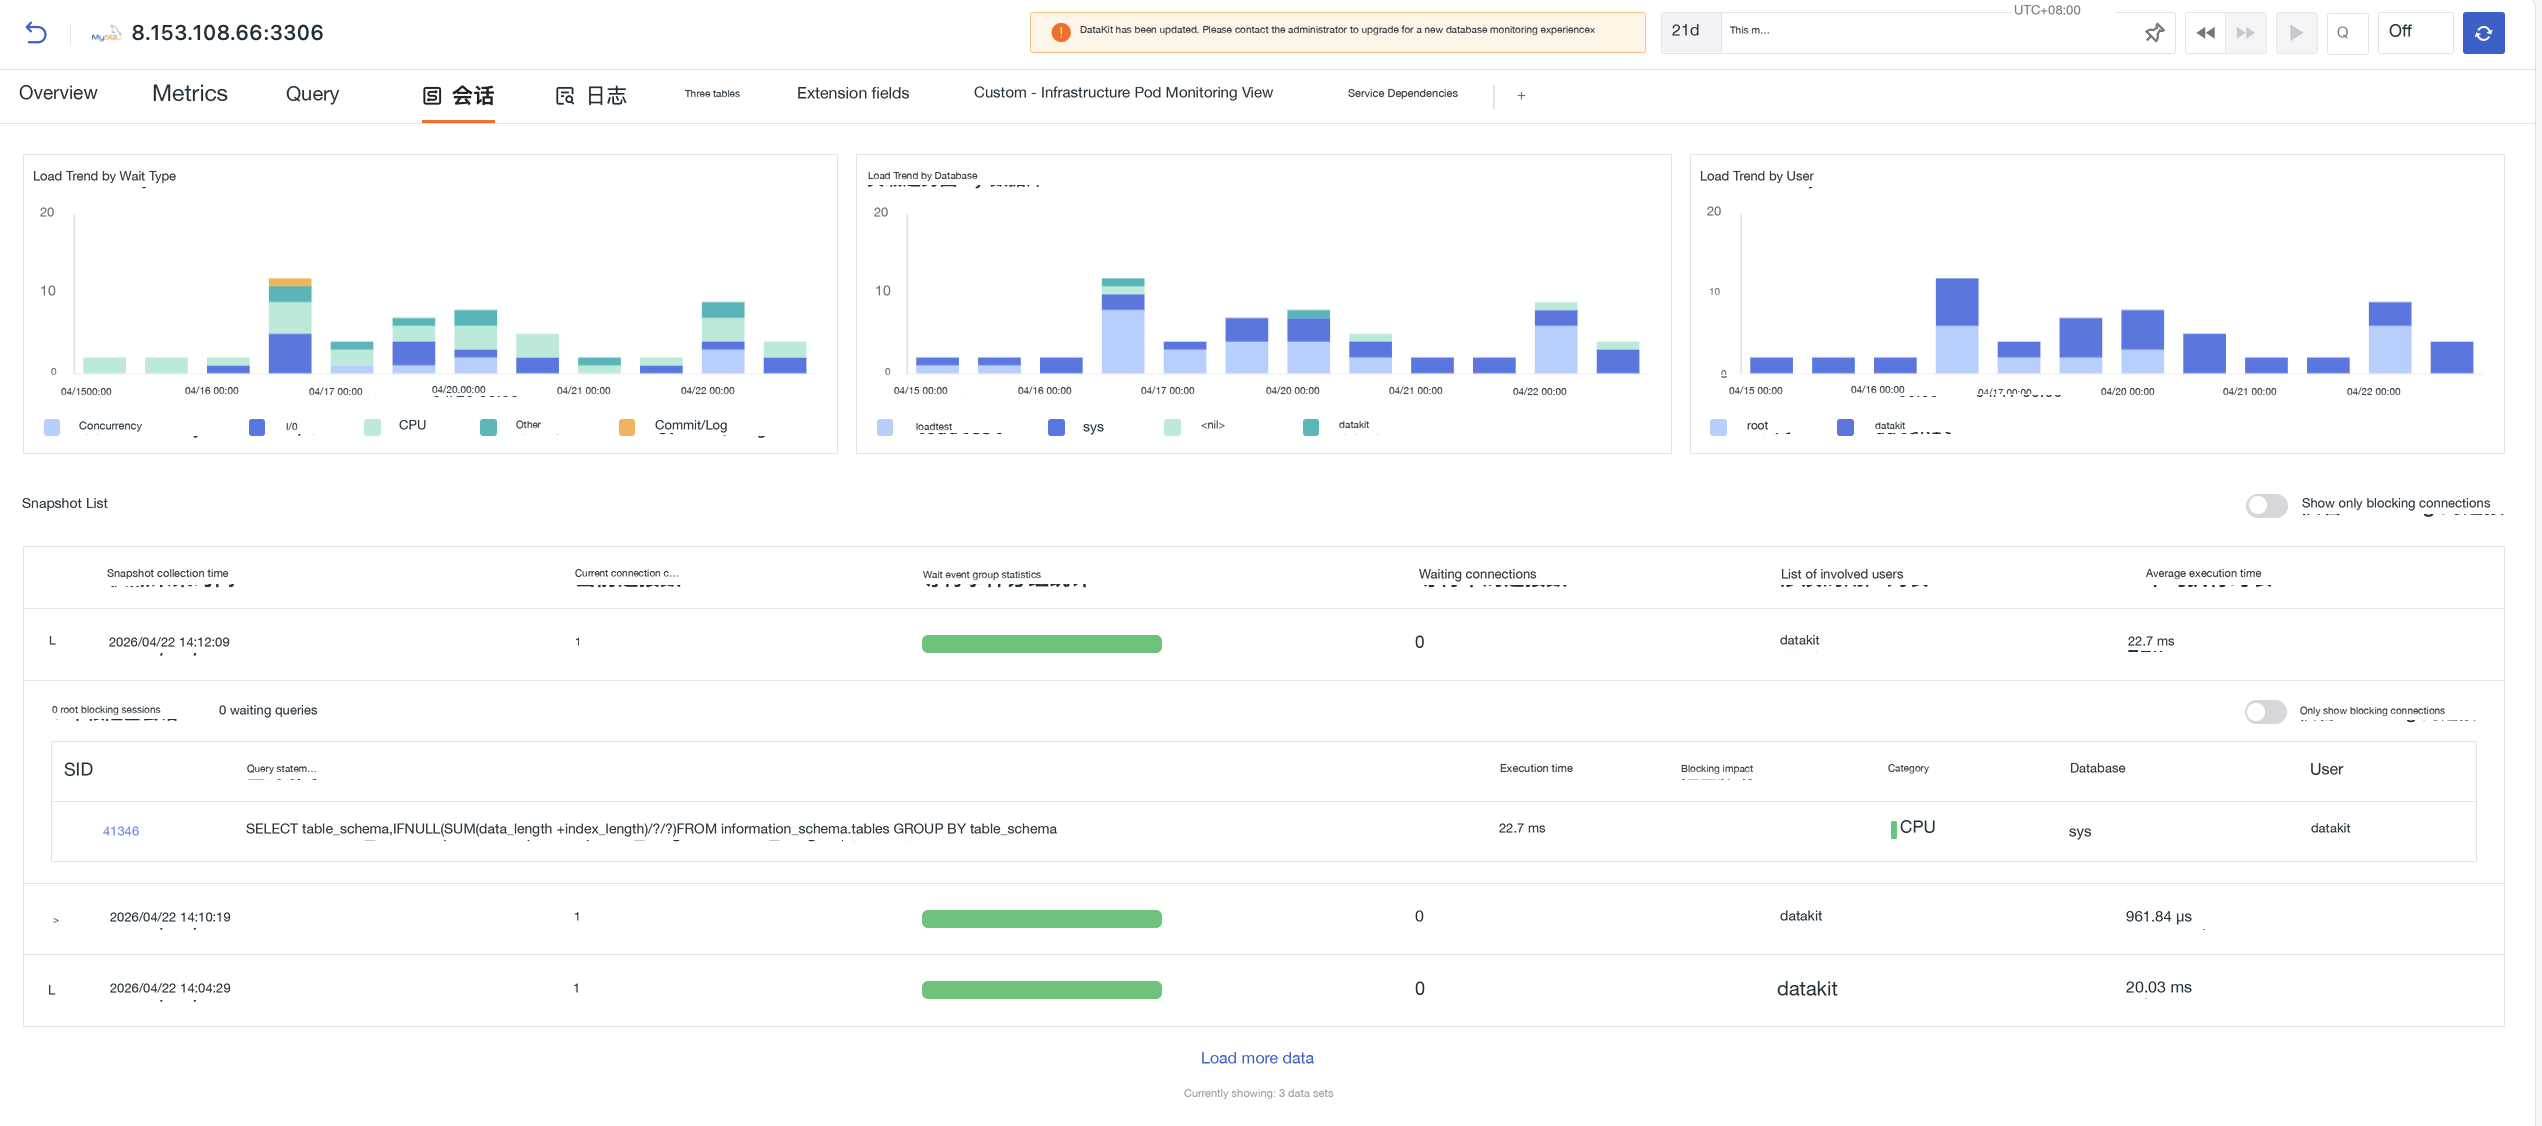
Focuses on connection sessions, lock waits, and blocking analysis to help diagnose concurrency conflict issues.
- The top shows a load trend chart aggregated by wait type, database, and user, with the vertical axis representing the number of active sessions at the corresponding time point;
-
Below is a snapshot list that aggregates session data by collection time point, including key metrics such as current connection count, wait event distribution, number of waiting connections, involved users, and average execution time.
- Click a snapshot to expand and view details. The expanded view shows a statistical summary of root blocking sessions and waiting query count, as well as a session detail list;
- Provides a filter toggle for "Show only blocking connections":
- Upper-right corner of the snapshot list: globally filter snapshots with blocking activity;
- Upper-right corner of the expanded snapshot detail: show only blocking-related sessions in the current snapshot.
Click a query statement in the session list to drill down further and view the detailed SQL performance data.
Logs
View database-related log data, including slow query logs, error logs, etc.
Tables
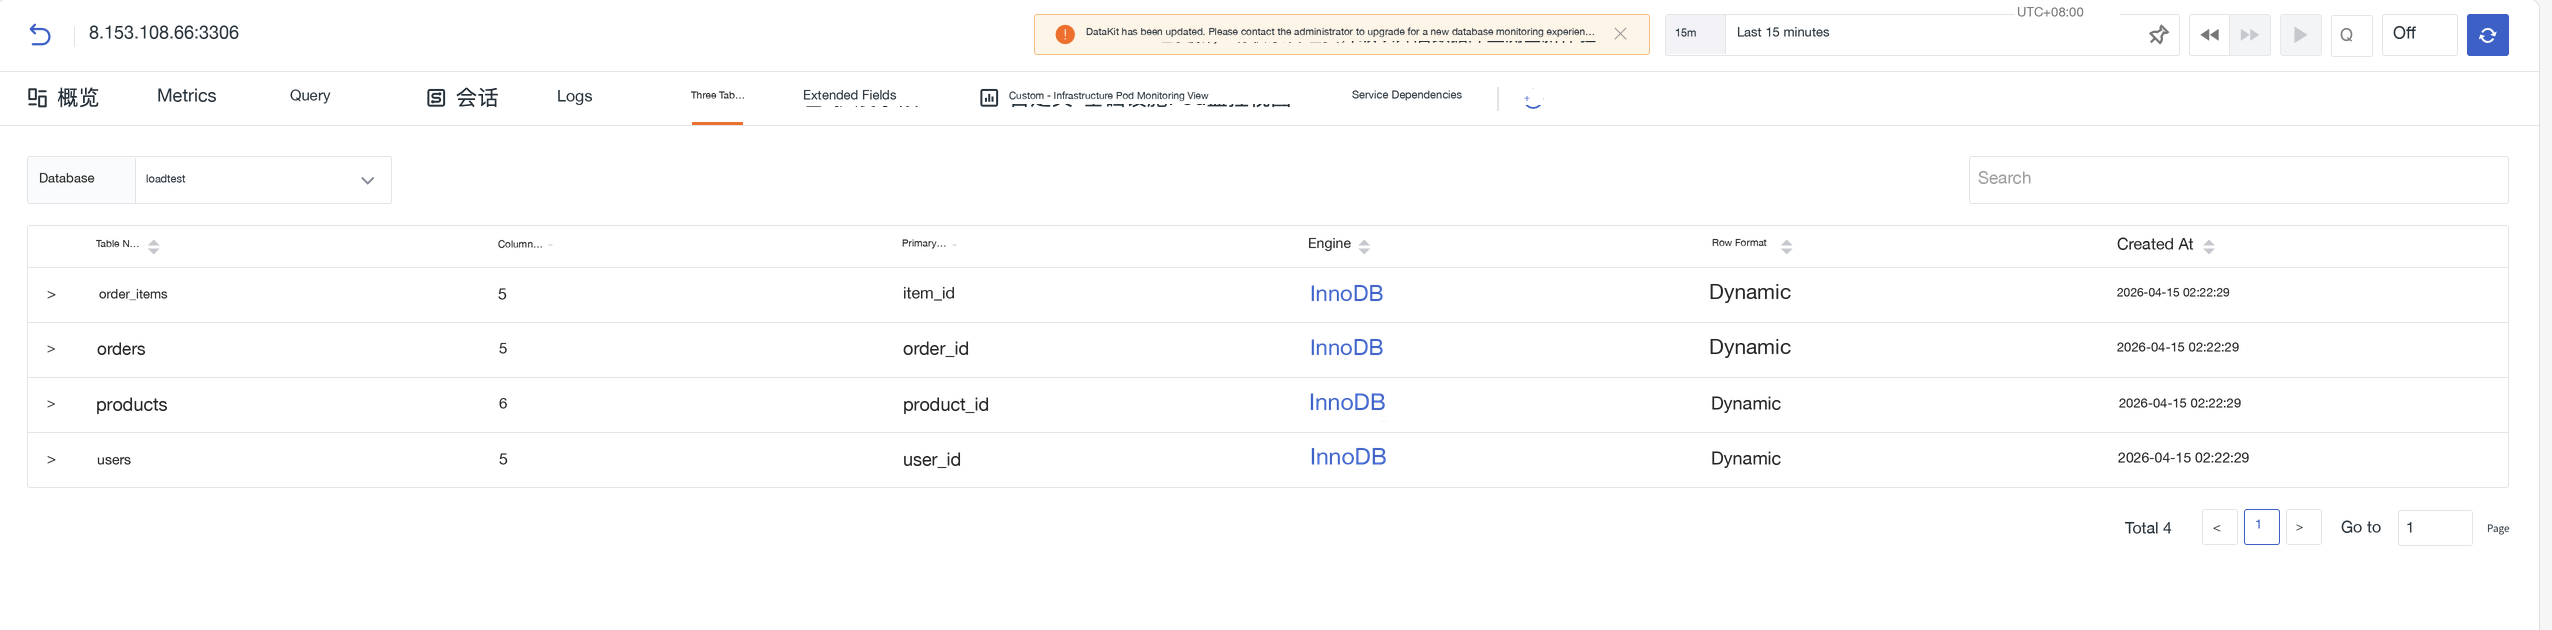
View database table structure information. Use the Database dropdown to switch the target database, or search for table names in the search box.
The list displays all tables in the current database, including the table name, column count, primary key, engine, row format, and creation time. Click a table name to expand and view the field structure details of that table.
Extended Fields
Displays the complete metadata of the instance in key-value pairs, supporting search by field name or value.
Custom Views
Centralizes user-defined views, with support for adding new views.